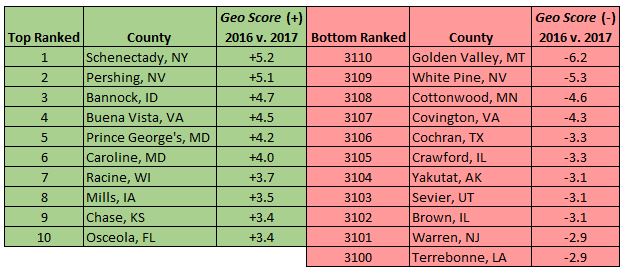
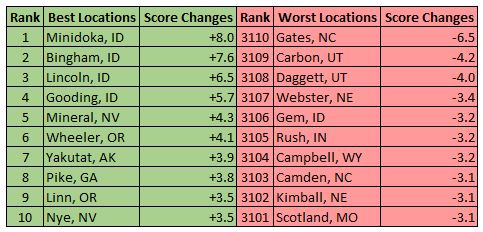
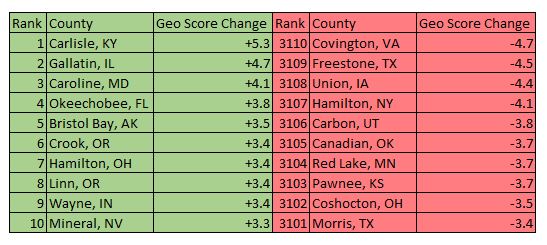
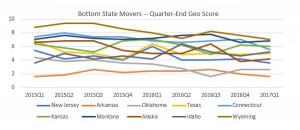
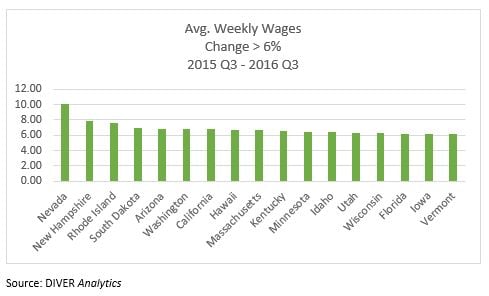
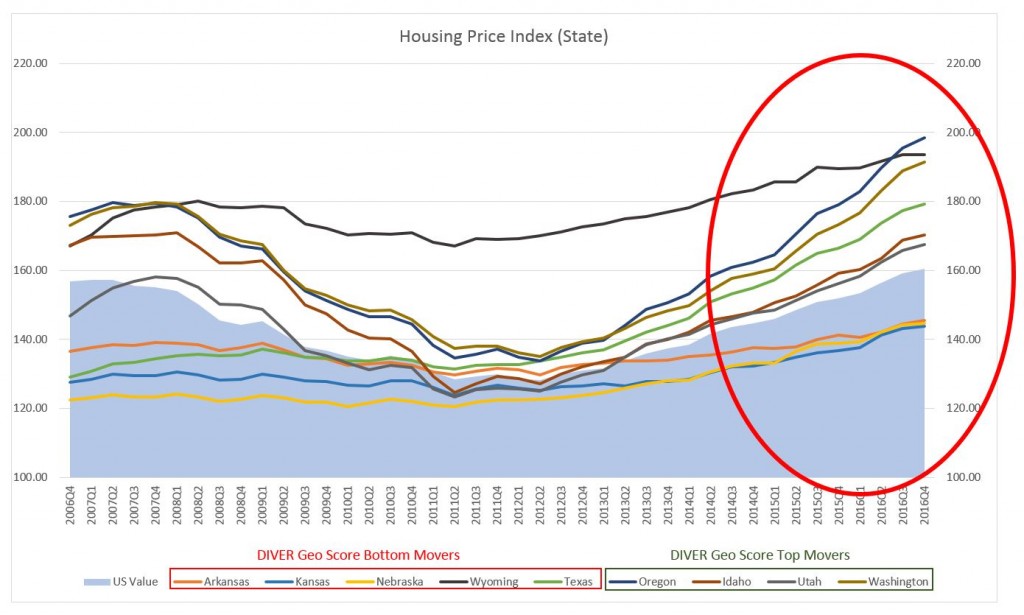
This week we bring you the September 2017 DIVER Geo Scores and take a broader look than we have over the past few months. In addition to presenting the locations with the greatest moves year on year, we also present the top and bottom Geo Scores for States, counties and cities for September. Why the change? Based on feedback, it seems readers want to see not only year on year changes, but also the current status of States, counties and cities at both ends of the Geo Score scale.
DIVER Geo Scores are designed to quickly communicate the overall economic health of a selected geographic area on a scale of 0 to 10. The Geo Score reflects the relative economic well-being of the location and is available for all States, counties, and approximately 350 of the largest cities. Calculations are released monthly and are based on multiple, meaningful economic and demographic data from the employment, income and housing categories.
