This week we bring you the May 2017 DIVER Geo Scores and a look at State level GDP data.
DIVER Geo Scores are designed to quickly communicate the overall economic health of a selected geographic area on a scale of 0 to 10. The Geo Score reflects the relative economic well-being of the location and is available for all States, counties, and approximately 350 of the largest cities. Calculations are released monthly and are based on multiple, meaningful economic and demographic data from the employment, income and housing categories.
Top/Bottom Movers at the State Level
The tables below highlight those States with the largest positive and negative moves. For the top States that had the most significant increases in their Geo Scores, our focus today is on the top seven (there were six that tied for the next spots at +0.4). Of our top seven, all saw improvement in their employment pictures with declining unemployment and increases in the labor force participation rate. Housing data was positive as well. However, it will be worth keeping a close eye on wages across the board as only Washington and Nevada, among our top seven movers, saw increased wages.
For bottom movers at the State level our focus is limited to the bottom seven (like top movers, there were seven States that came in next at -0.6). Of the bottom six, all saw declining wages and the employment data was very marginal with very little movement either way regarding labor force participation. As noted in prior months, despite seeing declines in their Geo Score, all but Connecticut saw moderately rising housing prices.
I continue to be troubled by the continual rise of housing prices, irrespective of other economic conditions. Of equal concern is poor wage data. A quick look at the States noted below and the addition of others that would round out the top ten (of both groups of movers) show all but two with declining wages. Moreover, the decline for average weekly wages for New York and Connecticut is meaningful (-$150 and -$130 respectively). The wage data is inconsistent with the employment data and housing data and shows a level of disconnect not seen in years.
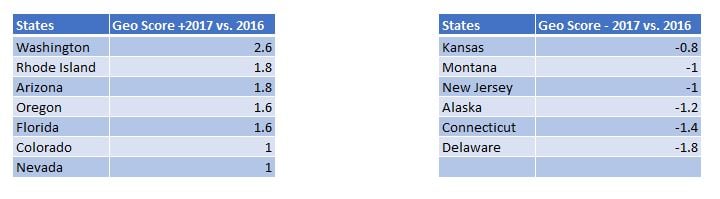 Source: DIVER Geo Scores
Before turning to the Counties and Cities, we wanted to add a data point to consider, State GDP. While not part of our Geo Score, it is a data point I have become more focused on at both the national and State level. Absent real GDP change (once finally adjusted), it is hard to see how the Fed can truly move forward with their planned interest rates hikes (how long have we been hearing about multiple hikes for 2014, 2015, 2016, 2017…) and how certain States can continue on without changes to their spending plans.
Last month, the Bureau of Economic Analysis released its 2016 State Real GDP. Compared to 2015, no State had GDP growth great than 3.7% (remember when +4% was the norm?), only 18 were above the US average of 1.62% and seven States saw a decline in their GDP. The data is available below this commentary. It may be worth looking to growth assumptions contained in State budgets.
County Level Geo Scores
At the county level, these top movers saw improvements in all data points – Okeechobee, FL; Crook, OR; Hamilton, OH; Linn, OR; Walton, GA; Langlade, WI; Bradford, FL; Door, WI; Costilla, CO; Marion, OR; and Hernando, FL. In addition, Bristol Bay, AK, Garfield, UT, Gallatin, IL and Door, WI all saw significant improvements in their unemployment rates.
Among counties with the greatest decline in their Geo Score, Freestone, TX and Lake of the Woods, MN both suffered large declines in their employment situation while Allegany, NY saw the largest drop in labor force participation rate. Finally, among this group, Coshocton, OH, Cortland, NY and Rockland, NY have seen fairly dramatic decreases in wages. Despite declining Geo Scores and associated data, all of our bottom movers still saw an increase in housing prices. As noted in prior Geo Score reports, I remain very concerned that the housing market is overheating.
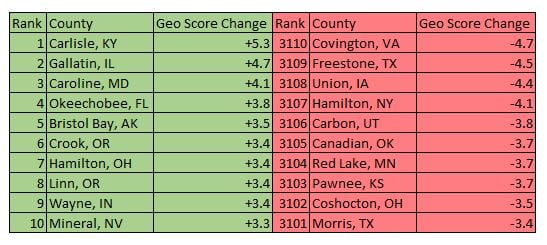 Source: DIVER Geo Scores
City Level Geo Scores
At the City level, all cities with the greatest increase in their Geo Score had improved employment and housing conditions along with rising wages. In contrast, cities with the greatest declines, dominated by cities within Texas, all saw a decline in their labor force participation rate and poverty was on the rise in five of the ten cities with North Little Rock seeing a spike of over 14%. All of the city bottom movers other than Corpus Christie and Longview Texas saw an increase in housing prices. Have I mentioned I am a bit concerned about housing prices?
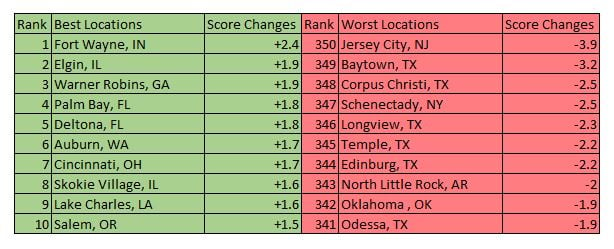 Source: DIVER Geo Scores
Have a great week.
Gregg Bienstock and Jane Ma
 Source: Bureau of Economic Analysis