This week we bring you the June 2017 DIVER Geo Scores and a look at population data for the 18-64 age group, aka the “working age group.” The numbers for the “working age group” may surprise (or concern) you.
DIVER Geo Scores are a measure of the overall economic health of a selected geographic area on a scale of 0 to 10. The Geo Score reflects the relative economic well-being of the location and is available for all States, counties, and 350 of the largest cities. Calculations are released monthly and are based on multiple, meaningful economic and demographic data from the employment, income and housing categories.
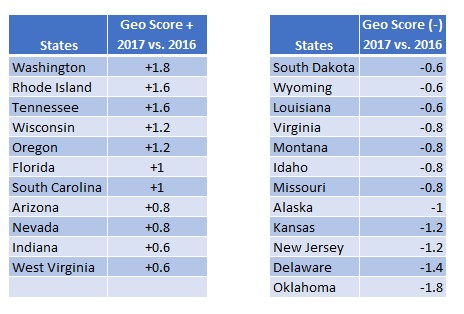
Top/Bottom Movers at the State Level
The tables below highlight those States with the most meaningful moves (positive and negative) for the period June 2016 to June 2017. For the top States that had the most significant increases in their Geo Scores, the focus is on the top 11 (there was a tie for #10). Of our top 11, all saw improvement in their employment pictures, improvement in the poverty rate and continued improvement in housing.
 Source: DIVER Geo Scores
For States with the most significant declines in their Geo Scores, our focus is the bottom 12 (as with the top movers, there was a tie at #10 with three States that came in at -0.6). Of the bottom 12, all but Alaska, Montana and Virginia saw declining labor force participation rates. As noted in prior months, despite seeing declines in their Geo Score, all saw rising housing prices, further fueling my concern that housing prices are frothy.
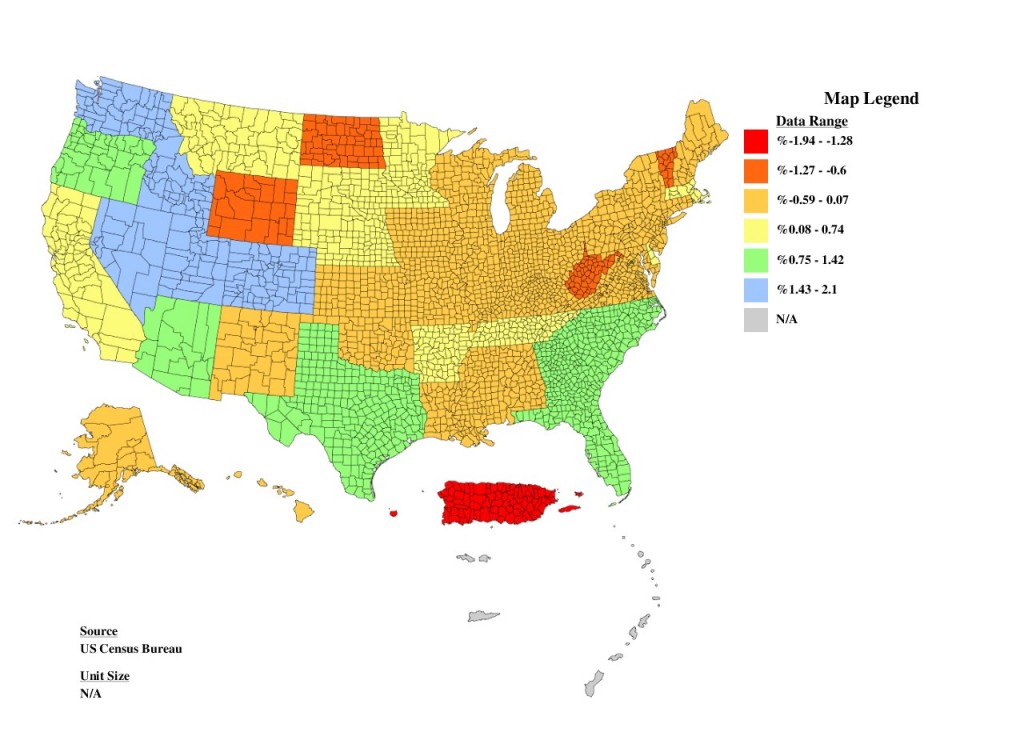
A component aspect of the labor force participation rate calculation is population of the 16-64 age group. Recently, the US Census Bureau released updated numbers for 2016 at the State and county levels. While we incorporate this data in our calculations, I thought it worthwhile to look at this data in isolation. We have highlighted locations with a declining working age population (counted as folks between ages 16 and 64) in red, dark and light orange. It is worth taking a closer look at additional data (wages, number of employed people and income tax projections) to ascertain what may be coming down the pike for those municipalities in terms of tax rolls, tax receipts and spending.
The map below shows the change in age 16-64 population from 2015 to 2016.
 Source: DIVER Analytics; US Census Bureau
There are 24 States that saw a decline in their working age population – and are worth keeping an eye on.
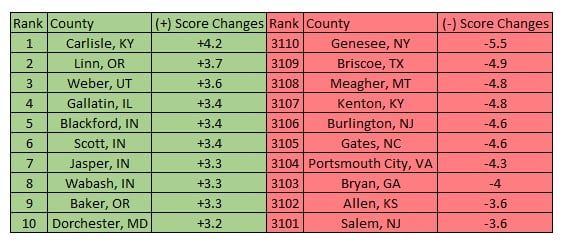
County Level Geo Scores
At the county level, most top Geo Score increases for the June 2016-2017 period saw improvements in employment data but several, including Scott, Jasper and Wabash, Indiana, all saw declining labor force participation. Additionally, our top counties saw improving housing data across the board.
Among counties with the greatest decline in their Geo Score over the past year, all but Kenton, KY, Portsmouth, VA and Bryan, GA saw deteriorating employment conditions coupled with declining wages. For each county in our bottom movers, all saw an increase in foreclosures but at the same time, continued to see housing prices on the rise, further highlighting my concern about the housing market.
 Source: DIVER Geo Scores
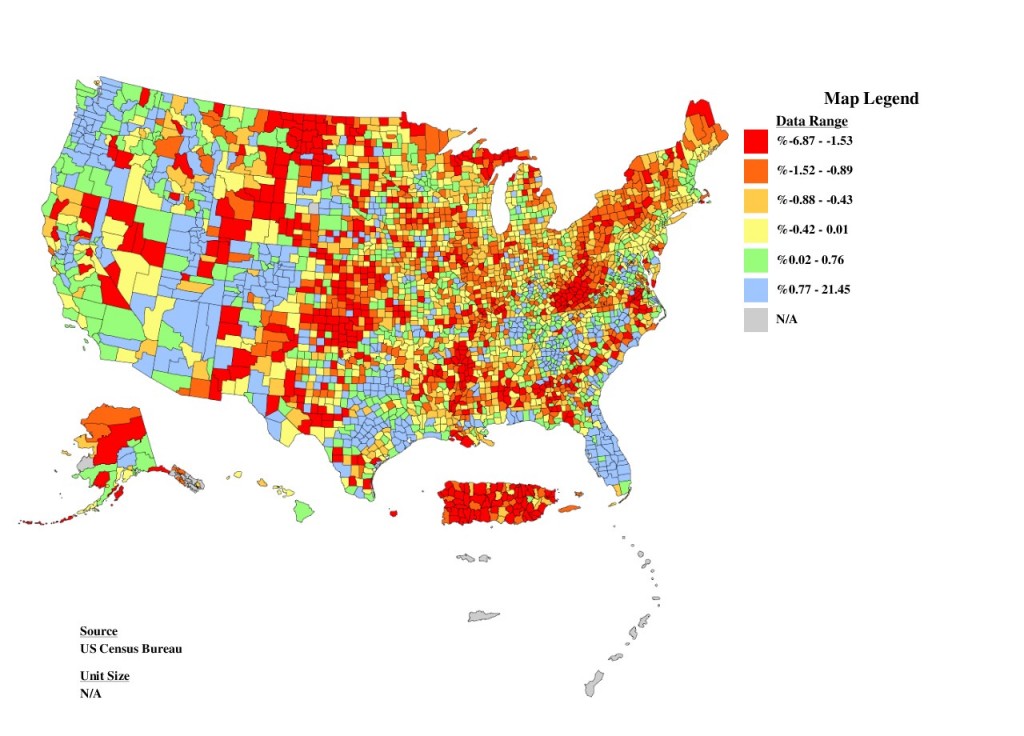
As with our State analysis, we again look at population at the 16-64 age group. In short, wherever there is a declining 16-64 population (declines indicated below in red, dark and light orange) it is worth taking a closer look at additional data (wages, number of employed people and income tax projections) to ascertain what may be coming down the pike for those municipalities in terms of tax rolls, tax receipts and spending. Some “hot” spots of concentrated decline are in Puerto Rico (not surprising), West Virginia, North Dakota, Wyoming and Oklahoma.
The map below looks at age 16-64 population from 2015 to 2016 and of the 3,232 counties, 1,067 (33%) saw a declining 18-64 population!
 Source: DIVER Analytics; US Census Bureau
City Level Geo Scores
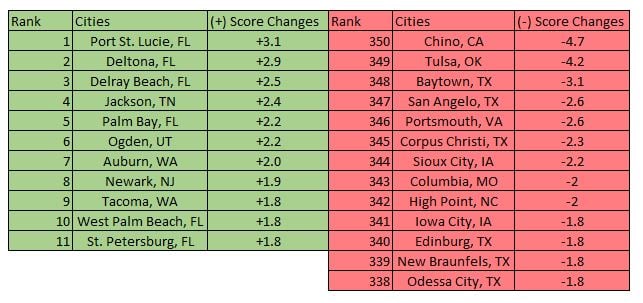
At the city level, all cities with the greatest increase in their Geo Score year from June 2016-2017 (we use the top 11 due to a tie at 10) had improved employment and housing conditions. However, Port St. Lucie, FL and Newark, NJ saw declining wages and rising poverty levels – a sign of concern.
In contrast, cities with the greatest Geo Score declines (using the bottom 13 due to a tie at 10), which are dominated by cities within Texas, all but Portsmouth, VA saw a decline in employment data and all but Baytown, TX and Columbia, MO saw deteriorating housing data (but not housing prices – all saw an increase except for Corpus Christi, TX). I hardly need to mention again that I’m concerned about housing prices!
In the tables below, it is worth noting the number of Florida cities in the positive mover side and the number of Texas cities on the other side of the ledger.
 Source: DIVER Geo Scores
Have a great week,
Gregg Bienstock and Jane Ma