This week we bring you the September 2017 DIVER Geo Scores and take a broader look than we have over the past few months. In addition to presenting the locations with the greatest moves year on year, we also present the top and bottom Geo Scores for States, counties and cities for September. Why the change? Based on feedback, it seems readers want to see not only year on year changes, but also the current status of States, counties and cities at both ends of the Geo Score scale.
DIVER Geo Scores are designed to quickly communicate the overall economic health of a selected geographic area on a scale of 0 to 10. The Geo Score reflects the relative economic well-being of the location and is available for all States, counties, and approximately 350 of the largest cities. Calculations are released monthly and are based on multiple, meaningful economic and demographic data from the employment, income and housing categories.
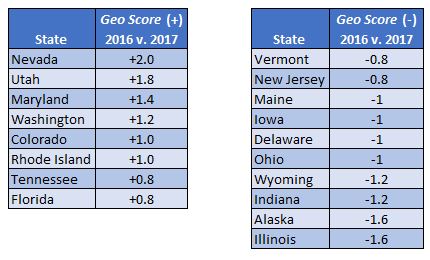
Top/Bottom Movers at the State Level
The tables below highlight the States with the most meaningful moves (positive and negative) year on year. For the top States that had the most significant increases in their Geo Scores, the focus is on the top eight. The employment picture for these States was positive, with Utah being the lone exception with a slight uptick in unemployment. All saw improved, stable to declining, foreclosure rates, improvements in wages and all but Maryland saw a decline in poverty rates (MD was flat). In the coming month, we will take a closer look at wages and income.
 Source: DIVER Data Solutions
For bottom movers at the State level, our focus is the bottom 10. Of the bottom 10, the underlying data was a mixed bag with some good news (all States seeing an increase in wages) and all but Wyoming and Vermont seeing a decline in poverty. The employment data wasn’t as kind, with six States seeing a decline in their labor force and unemployment ticking up in Alaska, Ohio and Delaware.
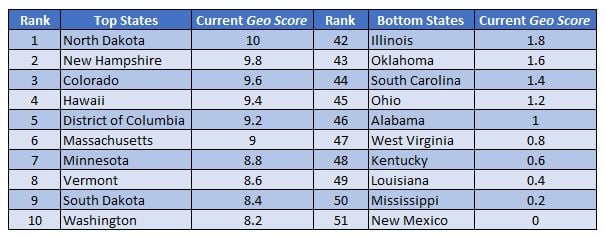
Top and Bottom State Geo Scores for September 2017
As promised, below are the September 2017 Geo Scores September 2017 (all can be found on our website).
 Source: DIVER Data Solutions
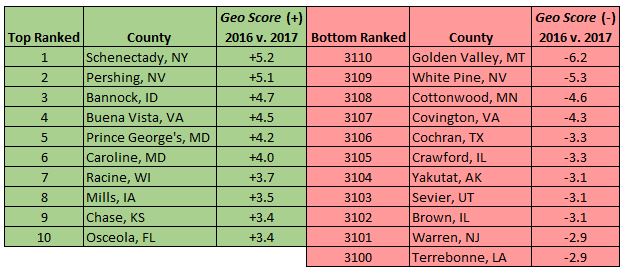
County Level Geo Scores
Let me start by giving a shout out to Schenectady, NY, home of Union College, for the significant increase year on year. At the county level, the data was positive, with wages and foreclosure data moving in the right direction. The employment data was also positive with two exceptions on the labor force front.
 Source: DIVER Data Solutions
Among counties with the greatest decline in their Geo Score over the past year, all saw poor foreclosure data and employment data (rate or labor force or, in some cases, both). The bright spot for some was around wages – more on this and income in an upcoming commentary.
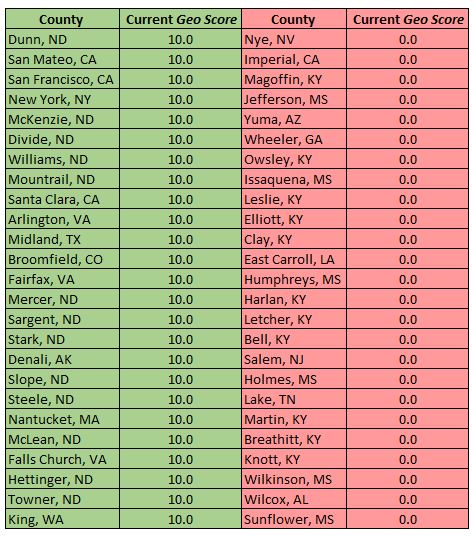
Top and Bottom County Geo Scores for September 2017 – As promised, below are the high and low Geo Scores for September 2017 (more can be found on our website). All are “10” or “0” so the ordering is not indicative of relative rank. Lots of ND on the positive side, with KY getting a slug of goose eggs.
 Source: DIVER Data Solutions
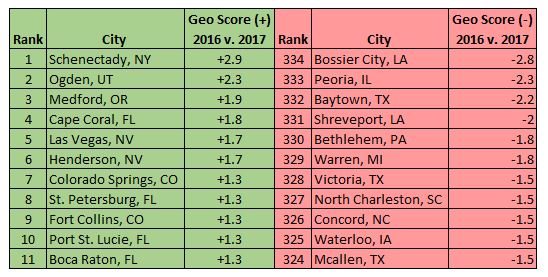
City Level Geo Scores
At the City level, it is not an error that you are seeing Schenectady on top again (there is a city and county). All cities in the positive mover category saw improved foreclosure and wage data, and all saw at least one component of employment data move in the right direction. However, it is worth noting that Colorado Springs and Port St. Lucie both saw increases in their poverty rates.
 Source: DIVER Data Solutions
For cities with the greatest declines, the silver lining is that all but Peoria, IL saw increases in wages. Conversely, on the foreclosure front, all saw an increase except Bethlehem, PA. Employment data showed declines in at least one component for all cities but Warren, MI and North Charleston, SC.
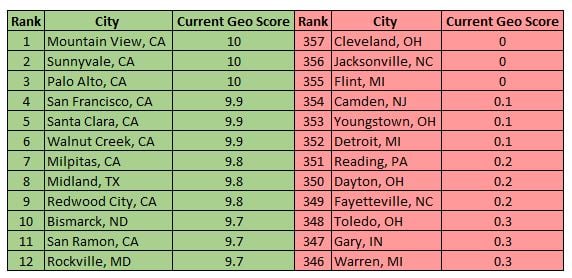
Top and Bottom City Geo Scores for September 2017
Below are the Geo Scores for September 2017 (more can be found on our website). Note the CA concentration on the green side.
 Source: DIVER Data Solutions
A special thanks to Jane Ma and Julie Wen for their always outstanding effort in pulling together our Geo Scores each month.
Have a great week.
Gregg Bienstock