This week we start with a review of the SEC’s announcement ending the MCDC initiative, a possible SEC focal point for 2017, and bring you the December 2016 DIVER Geo Scores. DIVER Geo Scores are designed to quickly communicate the overall economic health of a selected geographic area on a scale of 0 to 10 and reflect the relative economic well-being of all States, counties, and approximately 350 of the largest cities. Calculations are released monthly and are based on multiple, meaningful economic and demographic data from the employment, income and housing categories.
MCDC Initiative Ends (But Focus on Underwriters and Issuers Does Not)
As we all were preparing for the holidays and New Year, The Bond Buyer reported that the SEC said there will be no additional settlements under its MCDC initiative (read full story here). While this is good news for many market participants, it is not for others. LeeAnn Gaunt, Chief of the SEC Enforcement Division’s Public Finance Abuse Unit was quoted as saying “[w]e now think it is appropriate to turn our attention to issuers and underwriters and obligors that didn't participate” and noted that “significant resources” will be devoted. A not-so-subtle warning for those folks.
A subtler comment made by Gaunt may also be worth paying attention to. Specifically, the Enforcement Division devoting resources to learn about instances where some violations were not self-reported even though the Underwriter or obligated party reported others. Consider a scenario where an Underwriter did not submit certain deals based on their then view of materiality and subsequently settled with the SEC for deals submitted (note the settlements only relate to deals submitted). We now have 143 Underwriter and Issuer settlements with examples of what the SEC found to be material. Might that be the avenue the SEC pursues for those that submitted some but not all? Time will tell. While the MCDC Initiative may be done, it seems the Enforcement Division is not.
November Geo Scores: Top/Bottom Movers at the State Level
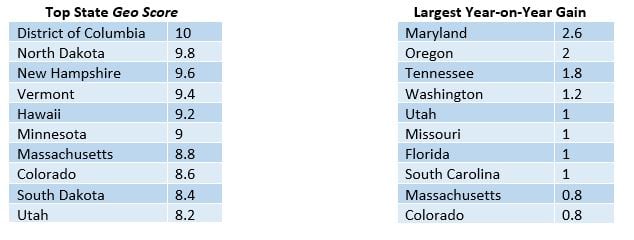
The table below, on the left, highlights the States with the highest Geo Scores for December 2016 and the table on the right highlights those with the greatest year-on-year increase in their Geo Score (impressive moves by the Terps, Ducks and Vols).
Of note among the Top 10, we saw, the addition of Utah (+1) and ouster of Connecticut (-.8).
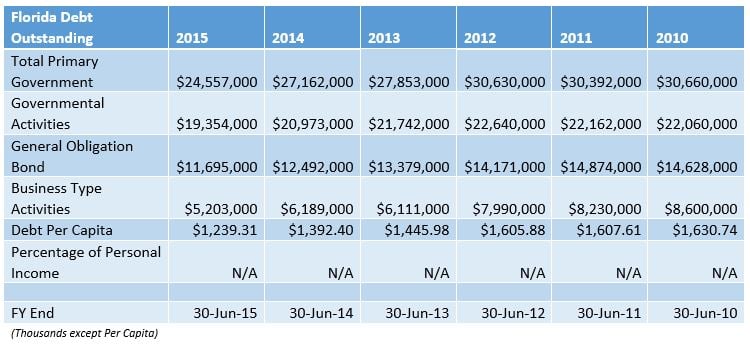
While Florida’s Geo Score is only 3.4, it has shown marked improvement (+1) over the last 12 months. The largest driver for this increase is an improving housing market. Additionally, the State’s CAFR highlights a declining general debt burden and associated debt per capita.
Next, we look at the States with the lowest Geo Scores and those with the largest decline. In other words, those States with relative declining or deteriorating economic conditions.
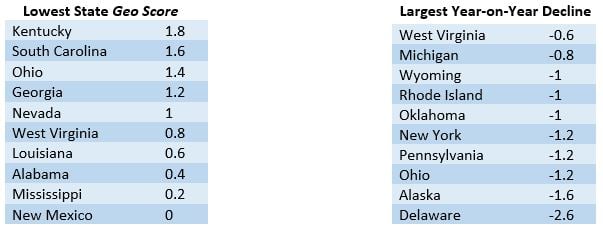
Of the States that have been in the category of most significant decline year-on-year throughout 2016, Alaska, Pennsylvania, Oklahoma and Wyoming saw an increase in unemployment while seven of the ten States suffered from declining labor force participation compared to 12 months prior.
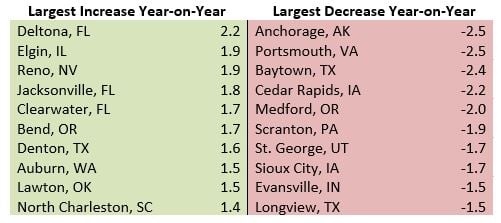
County Level Movers
At the County level, those with the largest increase in their Geo Score were most influenced by improved income and employment situations and a reduction in foreclosures. For counties that saw the largest decline in their Geo Score, all but four saw a deteriorating employment situation and a decline in wages.
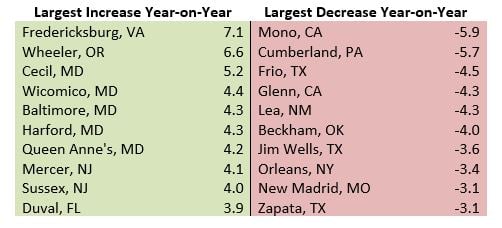
It is worth looking at these counties and, for those readers that have access to DIVER Analytics, we encourage you to run the filter tool against your portfolios for these bottom dwellers and further assess the credit.
Distress at County Level – Poverty
While most States have experienced an overall decline in Poverty Rates, the story is not the same at the county level. The map below shows Poverty Change from 2014 to 2015 – counties in red or orange are those that have seen an increase in their Poverty Rate. Let’s hope 2016 was better for those locations. We will provide an update once the data is released.
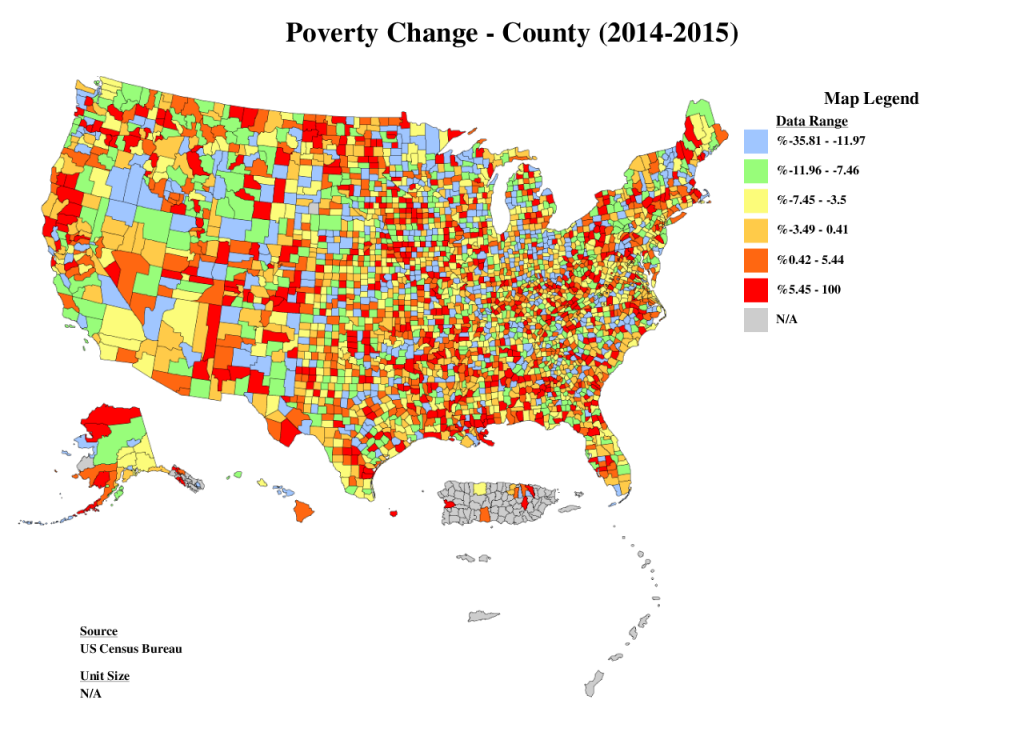
Source: DIVER Analytics, Map Module; US Census Bureau
City Level Movers
At the city level, we saw an improvement in employment and housing data as drivers for almost all cities with the 25 greatest increase in their Geo Score. Most of these cities are seeing an increase in the labor force participation rate – a strong employment indicator (more so than the unemployment rate from our perspective) – and wages.
For the 25 cities that saw the largest decline in their Geo Score, most saw declining housing data and an increase in poverty. As noted above, it may be worth running the DIVER Analytics’ Filter tool against positions held.
Have a great week.
Jane Ma and Gregg Bienstock