According to the DIVER Geo Scores from Lumesis, the employment situation continues to be the top story across all States. This month, we take a closer look at unemployment and labor force participation as well as touch on foreclosures.
DIVER Geo Scores are designed to quickly communicate the overall economic health of a selected geographic area on a scale of 0 to 10. The Geo Score reflects the relative economic well-being of the location and is available for all States, counties, and approximately 350 of the largest cities. Calculations are released monthly and are based on multiple, meaningful economic and demographic data from the employment, income and housing categories.Top and Bottom State Level Geo Score for October 2018
Below are the top and bottom ten States ranked by their Geo Scores for October 2018. For a full list of all states and their respective scores, visit our website.
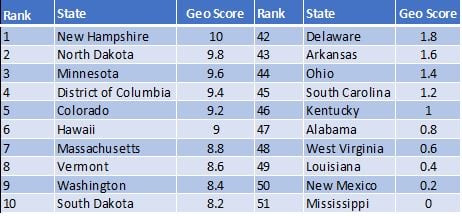
Source: DIVER Data Solutions
Top/Bottom Movers at the State Level
The Unemployment Rate was down for nine of the top ten movers for the Geo Score at the State level. Importantly, the Labor Force Participation Rate was flat or up for all of these States other than North Carolina. This is important as the Labor Force Participation Rate bounces off of historic lows and shows that the declining Unemployment Rate is real (as opposed to resulting from fewer folks in the labor force). Unemployment Rates are especially low in Idaho, Iowa, Indiana and Maine.
Amongst bottom movers, six of ten States saw a decline the Unemployment Rate with six of ten States seeing their Labor Force Participation Rate rise. Importantly, bottom movers Alaska, Montana and Arkansas saw solid employment data – lower unemployment and flat or increasing labor force participation. On a relative basis, several of the States with the Geo Scores with the greatest decline still have solid unemployment data – nine of ten are below 5%. The question to revisit is the absolute Labor force Participation Rate. In the housing market, Alaska and Nevada saw increases in foreclosures while all top Geo Score movers were flat or saw a decline in the Foreclosure Rate.
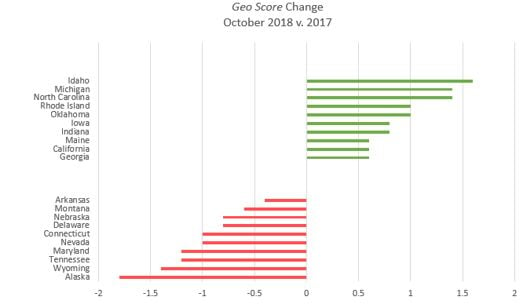
Source: DIVER Data Solutions
County Level Geo Scores Top and Bottom Movers
Below are the top and bottom 25 counties ranked by their Geo Scores for October 2018. For a full list of all counties and their respective scores, visit our website.
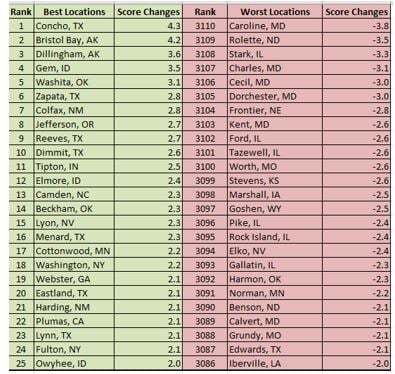
Source: DIVER Data Solutions
At the county level, all top mover counties experienced year-over-year decreases in Unemployment Rates, with Cottonwood County, MN seeing a whopping 4% decline. All but Jefferson OR, Camden NC, Menard TX and Cottonwood MN saw an increase in Labor Force Participation Rate.
At the bottom end of the scale, the majority of counties in this category saw an increase in their Unemployment Rate with Rolette County ND and Marshall County IA having rate increases of 3.6% and 2%, respectively, with eight others seeing increased rates of more than 1%. Labor Force Participation was improved in only six of the bottom mover counties.
When looking at the housing market, Foreclosure Rates in the top movers were flat or down in all counties except for Reeves, TX and Cottonwood, MN. Foreclosure rates in the bottom movers were flat or up for all other than Gallatin, IL. One other point of reference -- six counties in Illinois and six counties in Maryland ranked in the bottom 25 nationally.
Source: DIVER Data Solutions
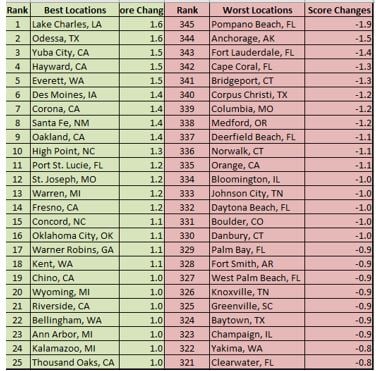
City Level Geo Scores Top and Bottom Movers
DIVER Geo Scores at the City/Town level reflect many of the same trends mentioned above. Specifically, most of those that show declining Geo Scores year-over-year have experienced increasing unemployment, poverty rates and foreclosures. Boulder CO, Johnson TN, Knoxville TN and Yakima WA all showed higher unemployment by more than 1% versus 12 months ago.
Not surprisingly, top performing cities and towns showed increases in employment. California had the most cities that were top performers last month with eight ranked in the top 25. Fresno CA had a declining Unemployment Rate (-2.1%), followed by Hayward CA (-2.0%), Riverside CA (1.6%), Yuba City CA (-1.4%) and Thousand Oaks CA (-1.4%). Michigan was next with three top performing cities including Ann Arbor and Kalamazoo.
Source: DIVER Data Solutions
A special thanks to Jane Ma and Julie Wen for their always outstanding effort in pulling together our Geo Scores each month.
Have a great week,
Gregg Bienstock