It’s that time of year again. With “Summer days driftin’away[1]” parents are spending money on clothes their kids will grow out of in a few months, and hotel magnates’ adult children are starting kindergarten to “prove to Dad that I am not a fool[2].”
Keeping that in mind, this week we have decided to analyze public school funding. So, sit up straight, spit out your gum, and let us examine the ten largest school districts in the country, as shown below.
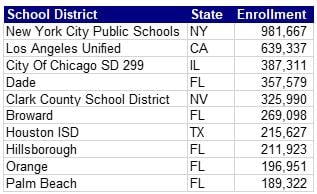
Sources: DIVER Data Solutions and Analytics, US Census Bureau
These districts, each with hundreds of thousands of students enrolled, received varying percentages of revenue from Federal, State and Local sources in 2016 (the last available data):
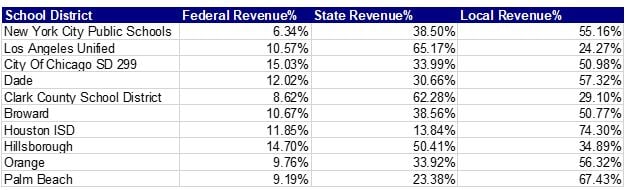
Sources: DIVER Data Solutions and Analytics, US Census Bureau
Above, we can see that Houston ISD (74.3%) receives the largest share of its revenues from local sources, which in the case of school districts, is chiefly through property taxes. Los Angeles Unified School District on the other hand, mainly raises revenue via state sources through which they received more than 65% of their revenues.
New York City Public Schools raised 55.16% of revenues through local sources. However, with implementation of the Tax Cuts and Jobs Act (TCJA) and the elimination of the State and Local Tax Exemption, the City may need to worry about a declining tax base at least from a residential perspective (which can lead to increased taxes for those that stick around).
It is also interesting to note that the Florida school districts have a significant variation of revenue received from local sources as Broward receives slightly more than half of its revenue from local sources and Palm Beach School District receives almost two-thirds of revenue from local sources.
The chart below shows information that provides some insight into how the various school districts manage their finances.
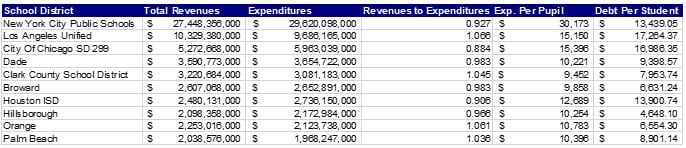
Source: DIVER Data Solutions and Analytics, US Census Bureau
One thing to keep in mind is that “Expenditures per Pupil” does not indicate how much money the school district is spending on educating individual students as expenditures may include employee salaries, benefits, supplies, and debt service, etc.
Taking all of this into account, we see some interesting statistics here:
- Los Angeles Unified School District has the highest ratio of revenues to expenditures (1.066) yet also the most debt per student at $17,264.37.
- New York Public Schools spends the most money per student and almost double the school district that spends the second most, Chicago SD 299. However, Chicago SD 299 owes $3,547.30 more per student.
- The School District with the least Debt Per Student, Orange FL also has the second highest Revenue to Expenditure ratio.
Chicago has the lowest revenue to expenditures ratio (0.884) and the second highest level of debt per student at $16,986.35. This indicates that Chicago may need to raise property taxes or cut expenditures, or both in the coming years. Which may be politically difficult due to the ongoing fiscal struggles the City and School District have dealt with in recent years and the political hot potato of cutting spending on education.
As the 2018-2019 school year kicks off and students get read to study “American History and practical math[3],” those of us in Muniland will continue to watch the financial and economic situation surrounding school districts in the United States.
Thank you very much and have a good week.
[1] “Grease.” Paramount Pictures, 1979.
[2] Billy Madison. Dir. Tamar Davis. Universal Pictures, 1995
[3] Chuck Berry. School Day (Ring Ring Goes the Bell), Universal Recording Studios, Chicago, IL, 21 Jan. 1957.