This week we bring you the July 2018 DIVER Geo Scores. With the economy seemingly on sound footing, we highlight States, counties and cities with lower Geo Scores and, importantly, those trending lower over the past year. In the coming weeks, we will revisit import and export sensitive States taking a closer look at trading partners and potential winners and losers from the ongoing tariff threats.
DIVER Geo Scores are designed to quickly communicate the overall economic health of a selected geographic area on a scale of 0 to 10. The Geo Score reflects the relative economic well-being of the location and is available for all States, counties, and approximately 350 of the largest cities. Calculations are released monthly and are based on multiple, meaningful economic and demographic data from the employment, income and housing categories.
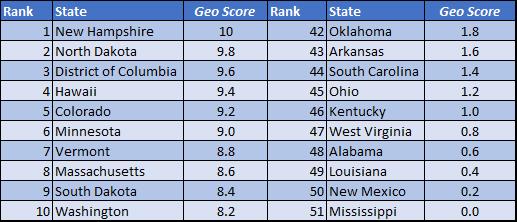
Top and Bottom State Level Geo Score for July 2018
Below are the top and bottom ten States ranked by their Geo Scores for July 2018. For a full list of all states and their respective scores, visit our website.
Source: DIVER Data Solutions
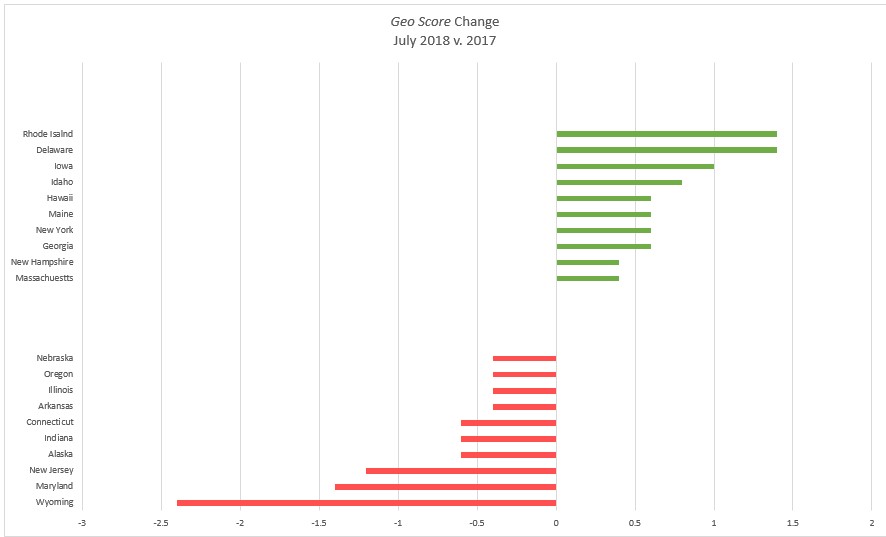
Top/Bottom Movers at the State Level
Almost all top State movers for the month (see below) saw improving employment conditions, including a decline in the Unemployment Rate and an increase in people participating in the Labor Force. Additionally, all States in this group, other than New Hampshire, saw lower foreclosures rates.
Source: DIVER Data Solutions
For those States seeing the largest declines in their Geo Score (see above), all but Indiana, Illinois and Nebraska saw a decline their Labor Force Participation and, of those States with a decline in their Labor Force, Wyoming, and Arkansas saw their Unemployment Rate go up (amongst this group of ten, only four saw an increase in the Unemployment Rate). While the employment data continues it positive trend, housing data is starting to show signs of fatigue with five of the bottom ten showing an increase in foreclosures.
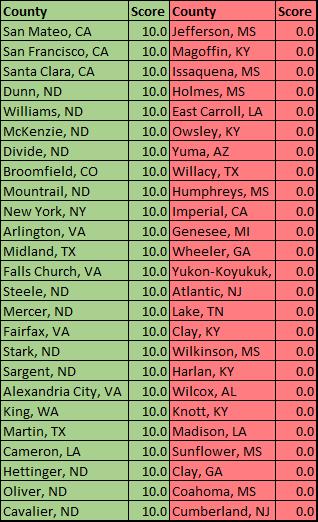
County Level Geo Scores Top and Bottom Movers
Below are the top and bottom 25 counties ranked by their Geo Scores for July 2018. For a full list of all counties and their respective scores, visit our website.
Source: DIVER Data Solutions
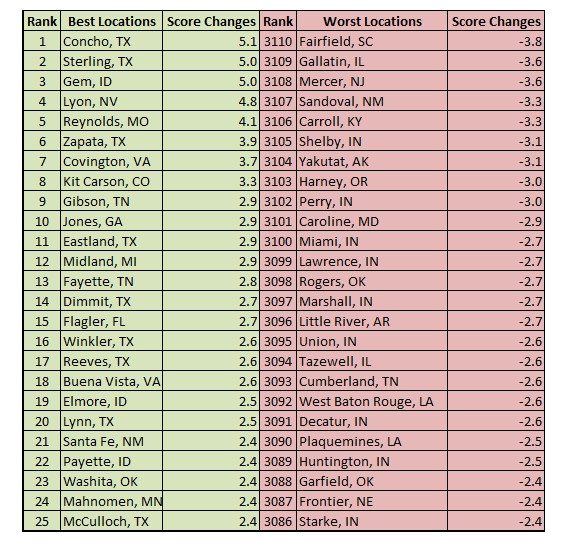
When looking at the top 25 movers by U.S. County (below), the major drivers this month were the Unemployment Rate, Labor Force Participation and Foreclosures Rates. Overall, for this group, the employment picture was very positive with all but Gibson, TN, Midland, MI and Fayette, TN seeing a decline in the Unemployment Rate and all but Sterling, TX, Covington, VA, Lynn, TX and Mahnomen, MN seeing their Labor Force rise. The housing data was equally strong with all but Midland, MI, Dimmit, TX, Winkler, TX and Reeves, TX seeing Foreclosures on the decline.
For those counties seeing the greatest decline in their Geo Score, Little River, AR and Huntington, IN deserve mention as both saw a relatively significant increase in their Unemployment Rates (1.1% and .9, respectively) while seeing a flat and declining labor force, respectively. The housing data was negative for all other than Tazewell, IL, with 24 of 25 counties in this category seeing rising Foreclosure Rates.
Source: DIVER Data Solutions
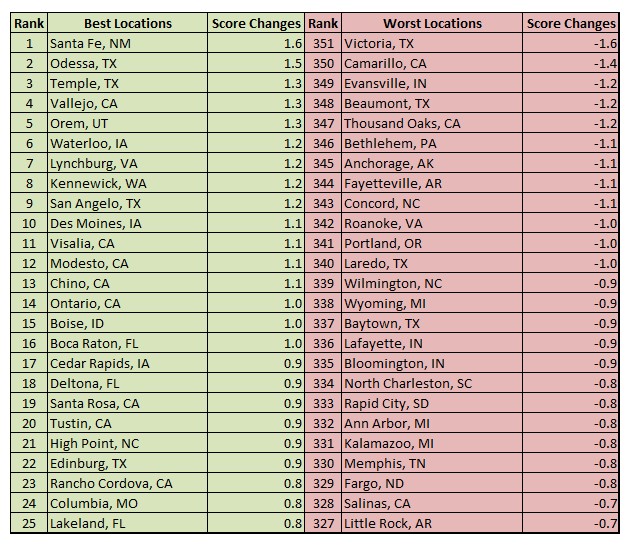
City Level Geo Scores Top and Bottom Movers
Among our top 25 movers, cities in California and Iowa dominate the list. The employment picture continues to be very positive for this group of cities with ten showing Unemployment Rates declining by more than 1% and an increasing Labor Force Participation Rate. All but Visalia, CA demonstrated solid housing data with flat or declining Foreclosure Rates.
The employment picture for the bottom movers was mixed. While 14 saw improving Unemployment numbers, only eight had flat or an increase in the Labor Force (the rest saw a declining Labor Force). It Is worth looking at this dynamic more closely as the Unemployment Rate decline can be deceiving (think Labor Force declining more than the number of employed people). All bottom movers, other than Thousand Oaks, CA, saw an increase in Foreclosure Rates.
Source: DIVER Data Solutions
A special thanks to Jane Ma and Julie Wen for their always outstanding effort in pulling together our Geo Scores each month.
Have a great week,
Gregg Bienstock