This week we bring you the May 2018 DIVER Geo Scores which highlight, in many instances, the improving employment picture. We will then look at the newly released 2017 census data and corresponding Geo Score trends.
DIVER Geo Scores are designed to quickly communicate the overall economic health of a selected geographic area on a scale of 0 to 10. The Geo Score reflects the relative economic well-being of the location and is available for all States, counties, and approximately 350 of the largest cities. Calculations are released monthly and are based on multiple, meaningful economic data and demographic data from the employment, income and housing categories. More information on Lumesis data and solutions can be found by visiting Our Solutions.
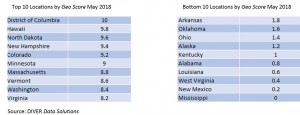
Top and Bottom State Level Geo Score for May 2018
Below are the top and bottom ten States ranked by their Geo Scores for May 2018. For a full list of all states and their respective scores, visit our website.
Top/Bottom Movers at the State Level
Almost all top movers for the month saw an increase in the labor force and lower foreclosures rates Unemployment rates dropped significantly for all top states (0.63% on average) for the month of April as detailed in the table below. Top movers also had improvement in housing data as reflected, in part, in Housing Price Index table below.
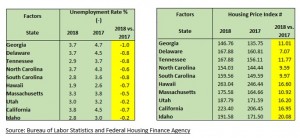
Despite a rosy jobs report, in April, the Unemployment Rate was higher for six of the bottom mover States compared to last year’s rates. At the same time, all of these States saw improvement in Housing Prices and seven of ten saw flat to declining foreclosure rates.
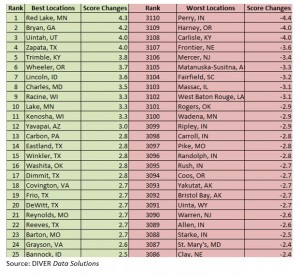
County Level Geo Scores Top and Bottom Movers
For the top 25 movers by County, almost all saw an improving employment picture (exception being Lincoln, ID); others that saw a decline in their Labor Force Participation Rate had a more than sufficient decline in the Unemployment Rate to offset the same. All counties in this group saw an improved housing picture with all seeing rising home prices and only three seeing an uptick in foreclosures.
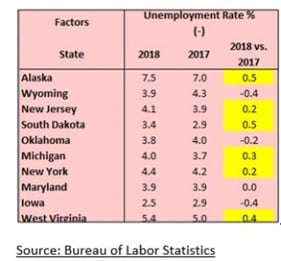
At the bottom of the scale, Indiana had seven counties (Perry, Ripley, Carroll, Randolph, Rush, Allen and Starke) ranked in the bottom movers due to negative employment data and increases in foreclosures rates. Three counties in Alaska had extremely high unemployment rates in April (>8.
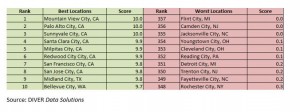
City Level Geo Scores Top and Bottom Movers
Among our top movers, cities in California continue to dominate the below table. Improving (continued) employment and housing data supported most of top movers
Almost all bottom movers experienced mixed housing data (prices keep going up but so do foreclosure rates) and mixed employment data.
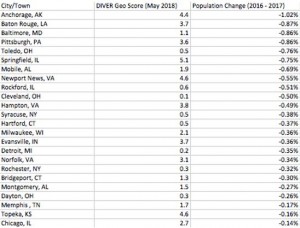
Population and Geo Scores
This month, the Census Bureau released 2017 population data for cities and towns in the United States. Population growth is an important factor to evaluate economic development. According to newly published data, the 24 large cities shown below (with populations of more than 100,000) had downtrends in population growth over the past 5 years. Note that across the board, these cities also have relatively low DIVER Geo Scores of 5.1 or lower out of 10.
A special thanks to Jane Ma and Julie Wen for their always outstanding effort in pulling together our Geo Scores each month.
Have a great week,
Gregg Bienstock