This week we bring you the March 2018 DIVER Geo Scores, focusing on locations with the greatest moves year on year, as well as the top and bottom scores at the State, City, and County levels for the month of March. We also look at employment to examine whether the picture is as rosy as it seems.
DIVER Geo Scores are designed to quickly communicate the overall economic health of a selected geographic area on a scale of 0 to 10. The Geo Score reflects the relative economic well-being of the location and is available for all States, counties, and approximately 350 of the largest cities. Calculations are released monthly and are based on multiple, meaningful economic and demographic data from the employment, income and housing categories.
Top/Bottom Movers at the State Level
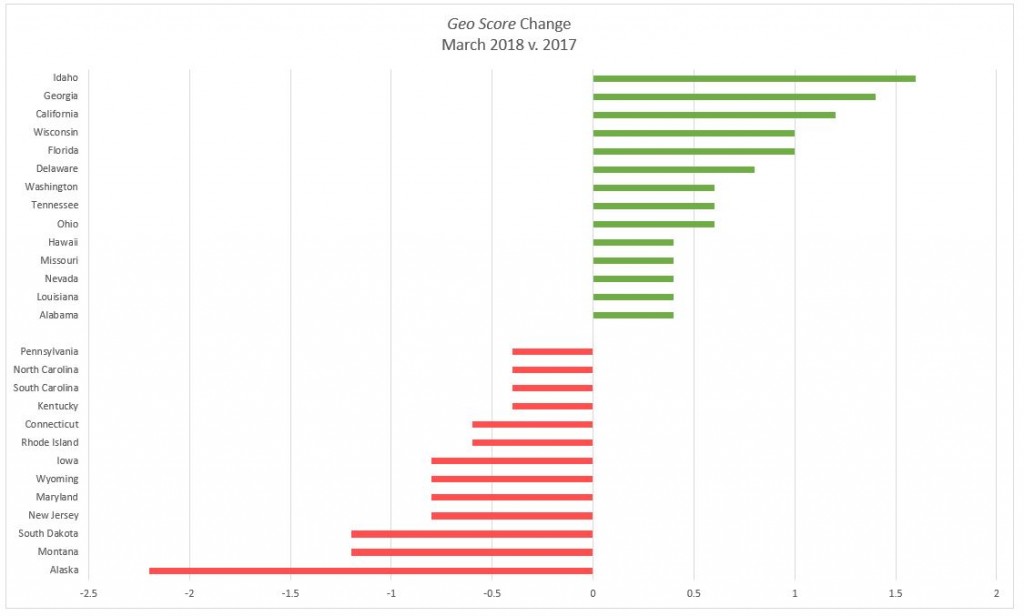
The chart below highlights the States with the most meaningful changes (positive and negative) year on year. Positive employment data contributed to improvements for the top 14 states with increases in their Geo Scores (there was a five-way tie for tenth place).
 Source: DIVER Data Solutions
In February (the most recent available data), the unemployment rates of most states hit a record low since the Bureau of Labor Statistics started tracking state-level unemployment in 1976. Six states had significant decreases in their unemployment rates: Tennessee (-1.3%), Wisconsin (-1.2%), Ohio (-1.1%), Florida (-0.9%), Hawaii (-0.8%) and Idaho (-0.8%). At the same time, almost all the top movers saw a year-on-year increase in labor force participation rates.
In contrast, Alaska had the highest year-on-year increase in unemployment, with an 0.8% rise, followed by Montana (0.5%), South Dakota (0.5%) and Rhode Island (0.3%). Alaska and South Dakota also saw a rise in foreclosures, and the majority of the bottom movers saw significant losses in the income category.
Will the US Job Market Reach Full Employment?
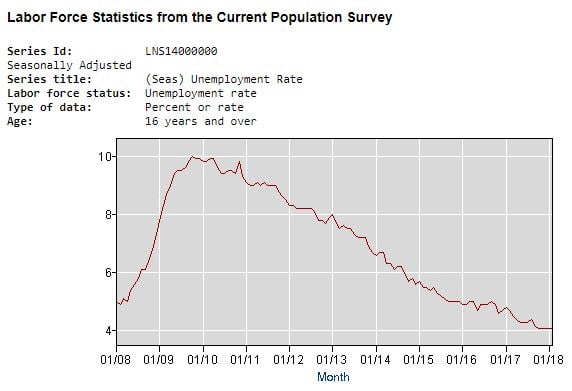
On April 6, the Bureau of Labor Statistics will release the March 2018 unemployment data. Many experts predict that unemployment rates will continue to go down, possibly even dropping to below 4%, which could be considered over “full employment” for the US labor market.[1]
 Source: US Bureau of Labor Statistics
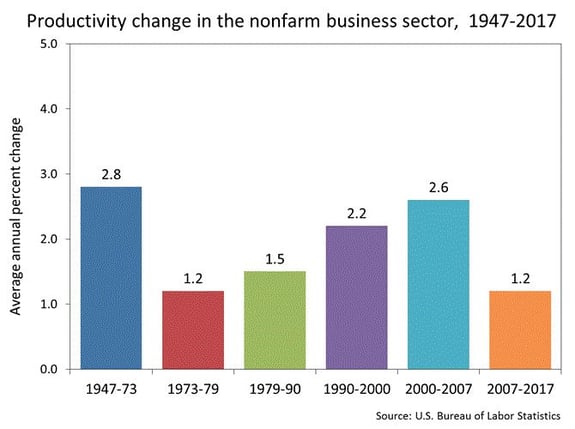
Although the low unemployment rates have impressed the market, they don’t always tell the full story and the health of job market could be overstated. When the labor market reaches a level at which additional employment doesn’t create enough productivity to cover the cost, the market has slack and is not working at peak efficiency despite low unemployment. Overall, labor productivity has not improved much in recent years (see chart below). Theoretically, if companies need to hire more people, they will also need to offer higher wages. But from the latest average weekly wages (please note that the wage data represents 2017 Q3, a lagging factor), we can see that this has not been the case in recent years. Even among our top state Geo Score movers, most states and municipalities have seen wage losses.
 Source: US Bureau of Labor Statistics
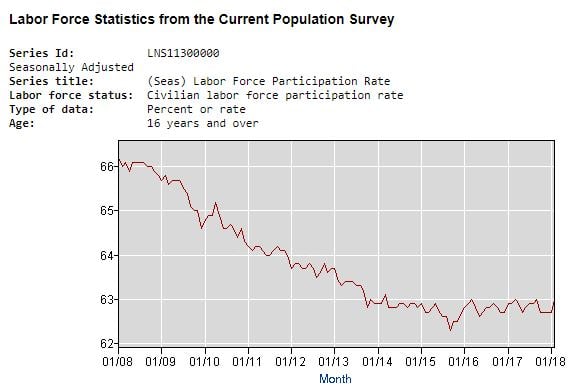
One possible explanation is that although unemployment has decreased, labor force participation rates have decreased or stayed flat (see chart below), so we are not experiencing true “full employment”. Nevertheless, unemployment rates and wage growth bear close watching in the upcoming months.
 Source: US Bureau of Labor Statistics
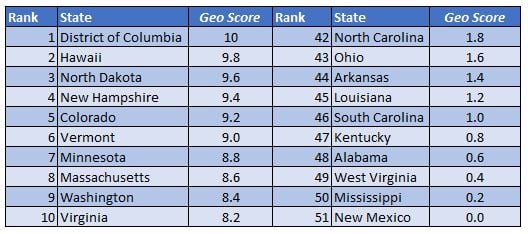
Top and Bottom State Geo Scores for March 2018
Below are the top and bottom March 2018 state Geo Scores (all of which can be found on our website).
 Source: DIVER Data Solutions
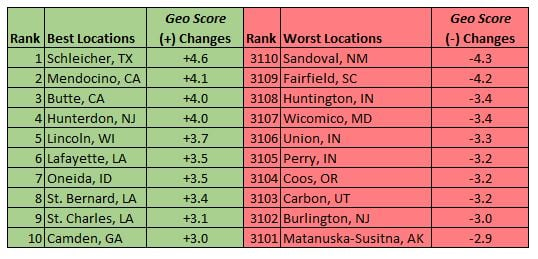
County Level Geo Scores Top and Bottom Movers
At the county level, all top county movers performed well in all Geo Score factors, particularly in the employment and housing categories.
Among the bottom movers, Indiana had 3 counties ranked in the bottom movers due to significant declines in labor force participation rates and increases in foreclosures and poverty rates. Sandoval County, NM and Fairfield County, SC both experienced wage declines well over $100.
 Source: DIVER Data Solutions
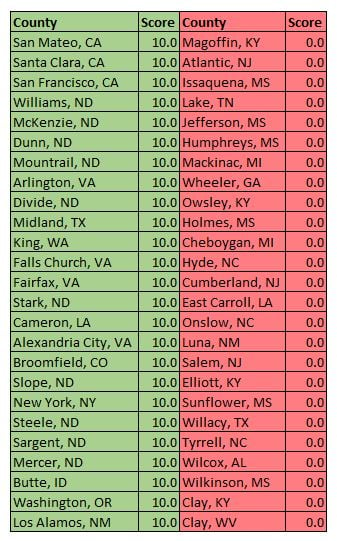
Top and Bottom Geo Score for March 2018
Below are the high and low Geo Scores for March 2018. All are “10” or “0” so the ordering is not indicative of relative rank.
 Source: DIVER Data Solutions
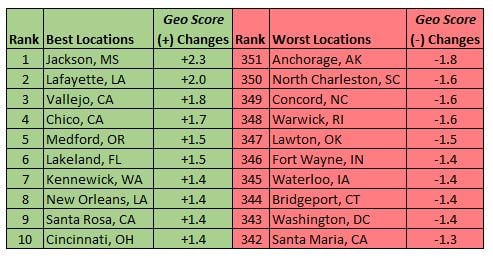
City Level Geo Scores Top and Bottom Movers
Among our top movers, cities in Florida and California continue to perform strongly. 7 cities in California and 6 cities in Florida had significant decreases in unemployment rates and foreclosure rates with improved labor force participation and housing prices.
Most of the bottom movers at the city level suffered losses in average weekly wages and increases in foreclosure rates.
 Source: DIVER Data Solutions
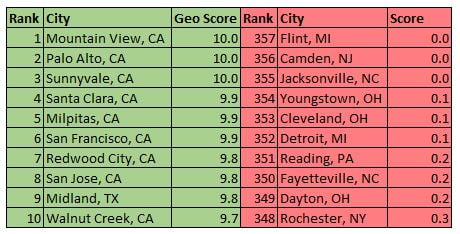
Top and Bottom City Geo Scores for March 2018
Below are Geo Scores for March 2018 (more can be found on our website).
 Source: DIVER Data Solutions
A special thanks to Jane Ma and Julie Wen for their always outstanding effort in pulling together our Geo Scores each month.
Have a great week.
[1] “The Fed is hogging the attention, but don’t forget this critical number for the economy.” MarketWatch, March 2018, Jeffry Bartash.