This week we bring you the January 2017 DIVER Geo Scores. DIVER Geo Scores are designed to quickly communicate the overall economic health of a selected geographic area on a scale of 0 to 10. The Geo Score reflects the relative economic well-being of the location and is available for all States, counties, and approximately 350 of the largest cities. Calculations are released monthly and are based on multiple, meaningful economic and demographic data from the employment, income and housing categories.
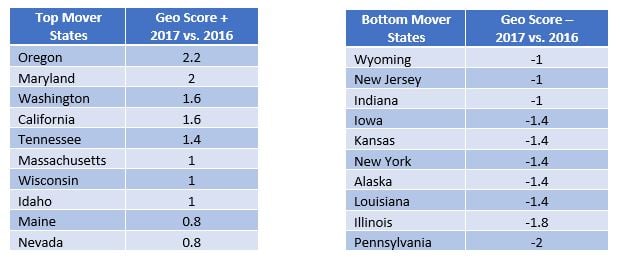
Top/Bottom Movers at the State Level
The tables below highlight those States with the largest positive and negative moves. For the top ten States that had the most significant increases in their Geo Scores, all saw improvements in their employment situation and wages, and all but Nevada (-.01) saw increases in their Labor Force Participation Rate. Bottom movers at the State level, including Pennsylvania, Louisiana and Wyoming, saw significant declines in employment and housing data as compared to 12 months prior. Alaska and Wyoming saw declines in wages.
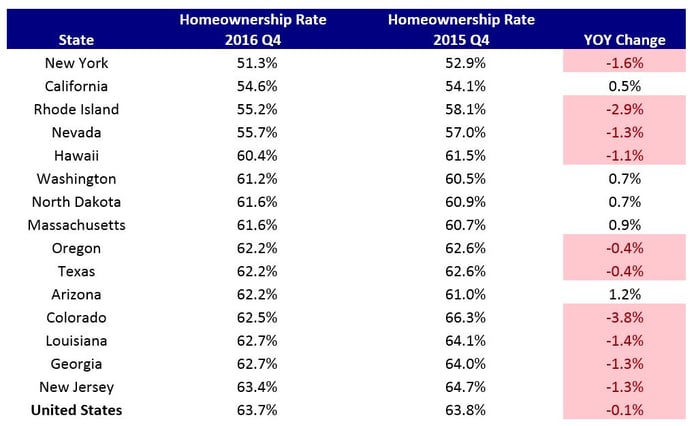
Below, we take a deeper look at two factors driving Geo Score changes for January. The Census Bureau released its fourth quarter homeownership rate of 2016, which fell slightly (-0.1%) compared to a year earlier. Among States with homeownership rates below the US average, the homeownership rate in 11 States (including New Jersey) also ticked down by an average of 1.6% over the last 12 months.
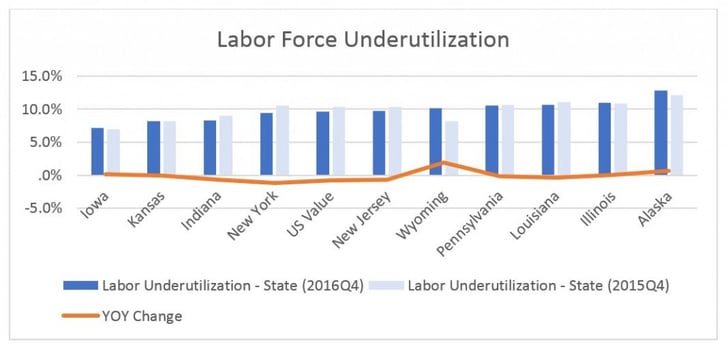
Next, most Geo Score bottom movers have seen decreasing labor force participation rates. Wyoming and Alaska have appreciable increases in Labor Force Underutilization year-on-year, according to the Bureau of Labor Statistics release.
County Geo Score Movers
At the County level, those with the largest increases in their Geo Scores saw marked improvement in their employment, wage and housing situations while counties with the largest decreases in their Geo Scores saw declining wages, mixed employment and housing data – the most concerning of which was an increase in foreclosures.
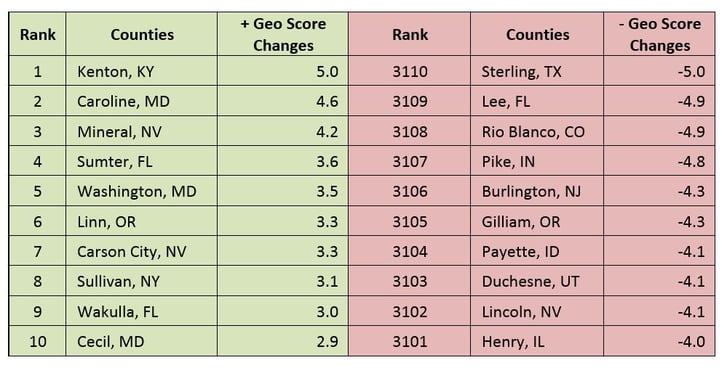
Unlike prior periods, we do not see a State level concentration in those counties with an increase or decrease in their Geo Score. This further highlights the importance of looking at areas at a more granular level as opposed to lumping municipalities together based on broader geography.
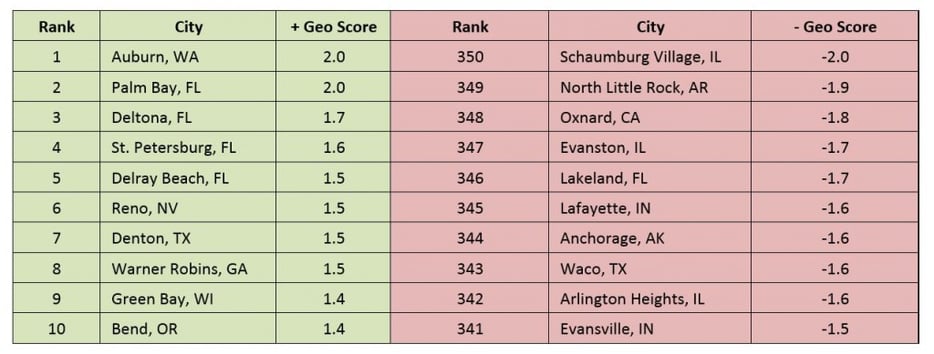
City Geo Score Movers
At the city level, the top Geo Score gainers saw marked improvement in their employment, wage and housing data. Cities with the most pronounced decline in Geo Scores saw deteriorating employment data and higher levels of foreclosures. Noteworthy amongst the top moving Geo Scores at the city level is the Florida concentration. Also noteworthy is that, while they didn’t make the Super Bowl, Green Bay nevertheless had an excellent year as it’s Geo Score increased by 1.4.
As seen above at multiple levels, unemployment and foreclosures are the major drivers of the January 2017 DIVER Geo Scores and warrant a closer look in geographic areas of concern to our readers.
Have a great week.
Jane Ma and Gregg Bienstock