This week we are going to dive deeper into a discussion of housing price trends and what a shift could mean for local governments’ finances. I wanted to start with and expand upon a comment that Gregg Bienstock made in his commentary on our November Geo Score update:
“Among counties with the greatest decline in their Geo Score over the past year, many saw relatively decent unemployment results, but Big Horn, MT saw a significant jump in its unemployment rate. All but Warren, NJ, Big Horn, MT and Burlington, NJ also saw a decline in their labor force participation. Housing was a mixed bag, with all but Big Horn, MT seeing a rise in the foreclosure rate while all but Tazewell, IL saw rising housing prices (yes, I am still concerned about the seemingly endless rise in housing prices).” (Emphasis mine.)Among the biggest negative movers on a county level, we see that, unsurprisingly, foreclosures were up and that declining unemployment numbers were largely offset by a decreased labor force participation rate. What deserves a further drill down, however, is the housing price aspect. Both the real and financial economies have long been based on the theory that housing prices will continue to appreciate. The obvious recent antithetical makes this current appreciation trend worth further examination. After all, how governments prepare during this upturn and react during the next downturn is important for their fiscal well-being and future economic growth.
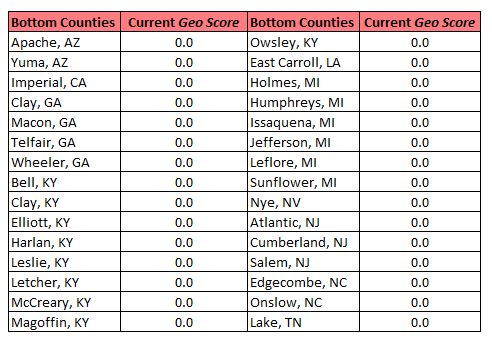
Let’s start by looking at poorly performing economic areas: The bottom 10% of Geo Score counties are comprised of 332 counties. For the November 2017 Geo Scores, Georgia leads the way with 59 counties in that group, followed by Kentucky with 36, Mississippi with 32, and North Carolina with 30.
Among the bottom 10% of counties, the average year-over-year housing price index changes since 2013 Q3 lagged the national county average by approximately a full percentage point. The bottom 10% were even further adrift from the housing price index growth rate of the top 10% of counties -- roughly 2 percentage points lower. That serves to restore a bit of sanity but the overall trajectory of housing prices continues to be a cause for concern (or at the very least, for some further examination).
According to the Federal Reserve, housing prices had been rising steadily from the 1970s right up until the Great Recession. The conventional wisdom that housing prices will continually rise was true - right up until it wasn’t.
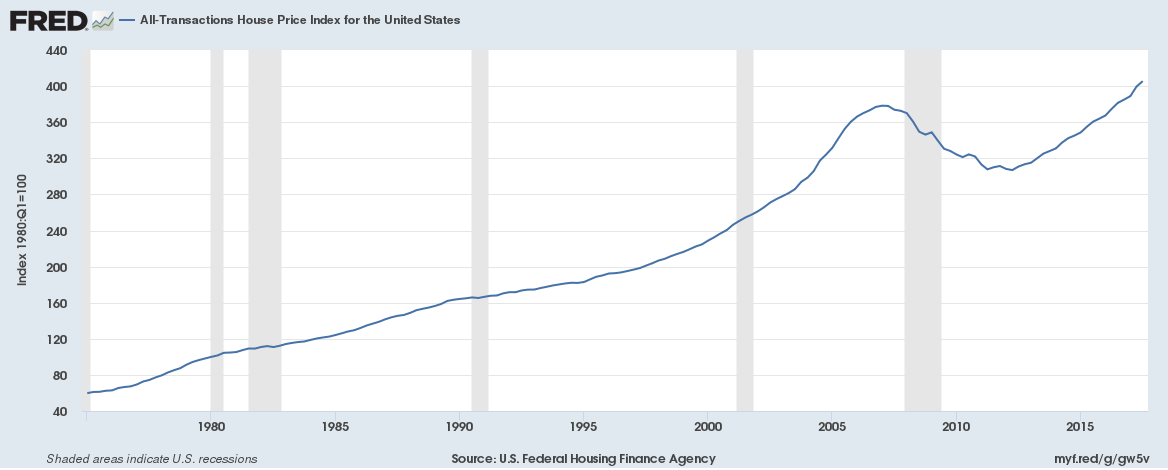 Source: U.S. Federal Housing Finance Agency, retrieved from FRED, Federal Reserve Bank of St. Louis
Let’s take a few hypotheticals and play them out:
Scenario 1) The old normal returns and housing prices appreciate for another 30 years.
Scenario 2) We see another dip like we did beginning in 2008 and the “old normal” does not return. There is a “new normal” which municipalities will need to navigate.
Scenario 1 is uninteresting so far as public policy decisions are concerned. While impossible to predict what the housing market will do, a multi-decade run of robust growth does seem unlikely. As the Great Recession fades further into memory, market participants can begin to act in the unsound ways that led us into the crash to begin with. A loosening of underwriting standards, increased speculation, and complex financial products that underpin it all make today’s housing market look much different than that of the mid- to late-20th century.
Scenario 2 presents policy makers with a whole host of worries. Let’s assume home values contract in the 20% range. A stark drop, to be certain, but far less than what was experienced in the last downturn, where values routinely contracted more than 30% and more than 50% in the hardest hit areas. Are local governments in a good position, or at least a better one than last time, to respond? It is not clear that they are.
An erosion of property values (and thus property tax revenues) is going to hit local governments particularly hard. States tend to derive the largest part of their revenues from income taxes, which are economically sensitive to be sure, but wages are stickier than housing prices so the hit to states can be smoothed out.
Local governments, by contrast, get their largest share of revenues from local property taxes (with the notable exception of school districts, which are typically funded via a combination of local property taxes and state aid formulas, but more on that later). Property revaluation schemes vary from state to state, so the immediate impact on localities will be uneven and depend on their revaluation/reassessment cycle. However, with the last recession serving as a guide, they will all see their revenues contract soon enough after this scenario beings. Further, some localities have strict property tax caps (looking at you, California) and others have limitless legal authority to raise mill rates.
There is, however, an important distinction between the legal authority to do something and the practical/political ability to do the same thing. Sure, Hartford, CT can continue to raise their property tax rate to continue making debt service payments and provide essential services, but it is already the highest mill rate in CT (outpacing its companion in financial misery, Waterbury, by 14 mills). At some point, perhaps years ago, a high mill rate puts you on the wrong side of the revenue hill and there is no longer any logic to raising it further.
Also troublesome on the local property tax front is the recently passed tax bill, which caps state and local tax (SALT) deductions from federally taxable income at $10,000. This issue creates headaches for policymakers, no matter what scenario we consider. Local governments in high tax states (Connecticut, New York, New Jersey, and, again, California) are going to have to rethink the financial burden now placed on constituents. Policy makers may be reluctant to raise taxes to their needed level, lest they make their locality unattractive to homeowners and homebuyers.
A scenario in which a local government is unable or unwilling to raise additional revenues naturally leads to expenditure cuts. But what if all the cuts have been made? Broadly speaking, the bottom 10% of counties that we noted earlier (the bottom 30 are noted in the table below; DIVER Analytics users can access this via the Filter module) have seen the share of their municipal workforce stay flat or decline between 2011 and 2017. Since labor is generally the largest cost for local governments, slashing payroll tends to be a go-to move in times of budget constraint. If employment levels have been whittled due to attrition or if there have been purposeful eliminations of positions that have not been reinstated, governments now have one less tool in their toolkit for when the next economic crunch hits. The fat has been trimmed, so to speak.
 Source: DIVER Data Solutions
Among the other large components of local government revenues are state transfers, mainly in the form of education cost-sharing. This too has not seen full restoration to pre-recession levels; when adjusted for inflation, 2015 state school funding levels are still below 2008 levels, again leaving little left to cut. In this hypothetical recessionary environment, stressed local governments would need more state assistance, not less. While increased automation and efficiency can lead to lower costs in some services, the price of labor in things like education and public safety will continue to be a local government expenditure driver for the foreseeable future.
With the tax bill already creating headaches for municipalities in the form of the loss of tax-exempt advance refundings, lower corporate and individual income tax rates potentially making muni bonds less attractive to a wide swath of investors, and the aforementioned SALT deduction cap, local governments may struggle to cope with future housing price downturns more so than in the past. Relying on accumulated fund balances could help them weather such a storm, but reserve levels vary widely and those with relatively poor economies (at the lower end of the Geo Score spectrum) are less likely to have saved for the proverbial rainy day. A use of reserves for recurring expenses means that critical investments in core services such as education and infrastructure will surely lag behind what is required, as little flexibility is left over for pay-as-you-go capital spending. Governments found a way to cope as they navigated through the last recession (escaping Meredith Whitney’s forecast) but many find themselves more precariously positioned as the next recession surely looms.
Have a great week.