This week we bring you the November 2017 DIVER Geo Scores. In addition to presenting the locations with the greatest moves year on year, we also present the top and bottom Geo Scores for States, counties and cities for November.
DIVER Geo Scores are designed to quickly communicate the overall economic health of a selected geographic area on a scale of 0 to 10. The Geo Score reflects the relative economic well-being of the location and is available for all States, counties, and approximately 350 of the largest cities. Calculations are released monthly and are based on multiple, meaningful economic and demographic data from the employment, income and housing categories.
Top/Bottom Movers at the State Level
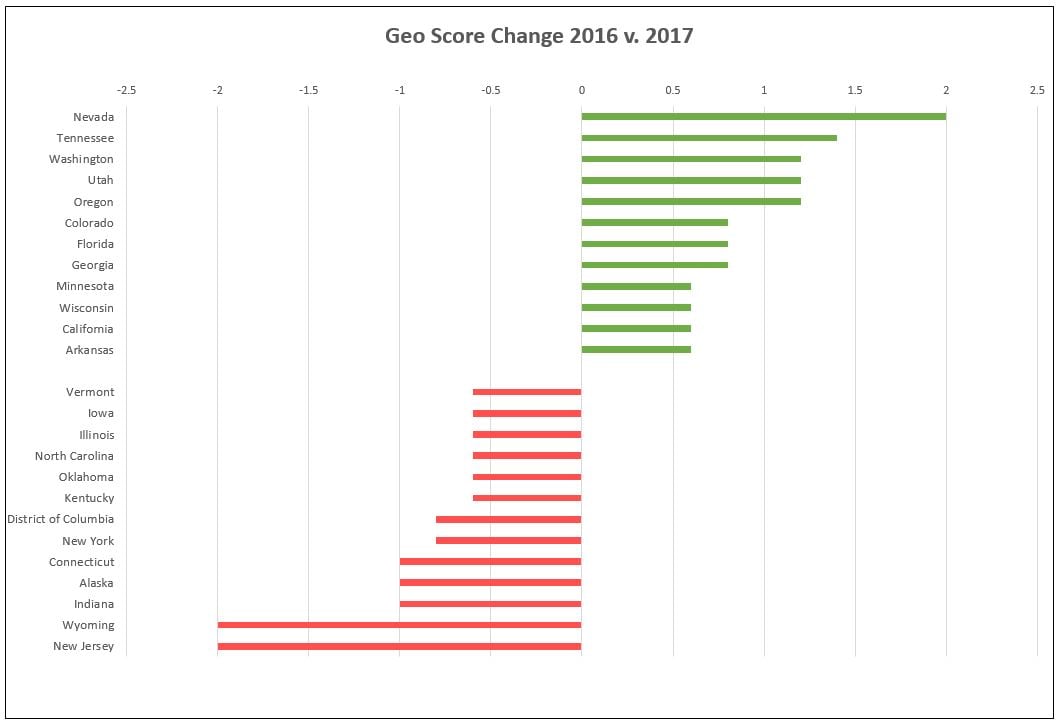
The chart below highlights the States with the most meaningful moves (positive and negative) year on year. For the top States that had the most significant increases in their Geo Scores, the focus is on the top 12. The employment picture for these States was positive, with all seeing an improved (growing) labor force and Tennessee and Florida seeing a greater than 1% decline in unemployment. Also of note is the >1% decline in the poverty rate for Utah, Oregon, Florida and Georgia. All States in our top 12 also saw an improving housing picture, with declining foreclosure rates and increasing housing prices.
 Source: DIVER Data Solutions
For bottom movers at the State level, our focus is a baker’s dozen. Right off the top, it is worrisome to see the Amtrak 95 corridor so prominently represented for the second month in a row (DC, NJ, NY, CT). Could this be further exacerbated with the potential tax overhaul? Alaska and DC saw worsening employment pictures and Wyoming, DC and Oklahoma all saw an increase in Poverty. Of the bottom 13, the greatest deterioration in factors across our data points was DC - keep an eye on their data in the coming months (nevertheless, DC’s overall score is still rather healthy -- see below).
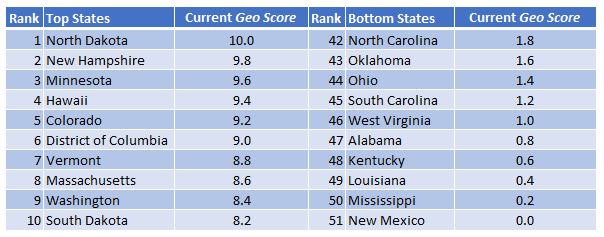
Top and Bottom State Geo Scores for November 2017
Below are the November 2017 Geo Scores (all can be found on our website).
 Source: DIVER Data Solutions
County Level Geo Scores
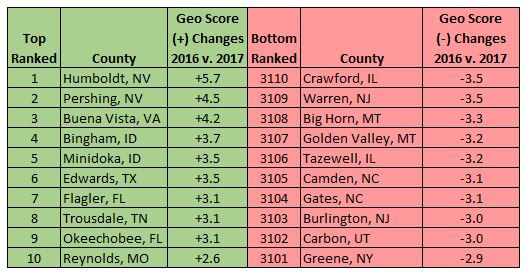
At the county level, the data was positive, with all our top movers seeing a decline in their unemployment rate and all but Flagler, FL and Trousdale, TN seeing an increase in their labor force participation rate. Similarly, this group saw a decline in the foreclosure rate and an across the board increase in housing prices.
 Source: DIVER Data Solutions
Among counties with the greatest decline in their Geo Score over the past year, many saw relatively decent unemployment results, but Big Horn, MT saw a significant jump in its unemployment rate. All but Warren, NJ, Big Horn, MT and Burlington, NJ also saw a decline in their labor force participation. Housing was a mixed bag, with all but Big Horn, MT seeing a rise in the foreclosure rate while all but Tazewell, IL saw rising housing prices (yes, I am still concerned about the seemingly endless rise in housing prices).
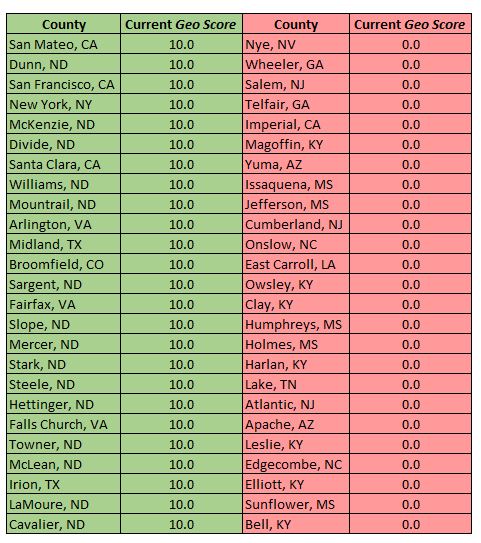
Top and Bottom County Geo Scores for November 2017
Below are the high and low Geo Scores for November 2017 (more can be found on our website). All are “10” or “0,” so the ordering is not indicative of relative rank. ND continues to dominate on the positive side.
 Source: DIVER Data Solutions
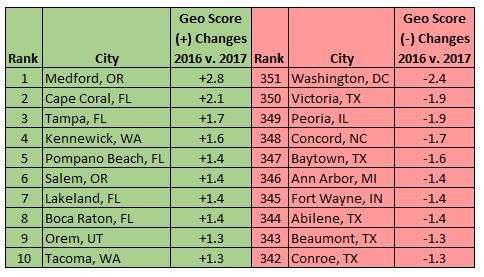
City Level Geo Scores
All cities in the positive mover category saw improved unemployment rates and improved labor force participation, with the exception of Cape Coral, FL. Poverty was down across this group and housing data was thumbs up as well.
 Source: DIVER Data Solutions
For cities with the greatest declines, Washington, DC is our standout loser (each party can blame the other). For our friends in Ann Arbor who have suffered a tough football season, one has to ask if there is a correlation between an underperforming Wolverine team and a declining Geo Score. Of this group, all saw declining labor force participation rates and, with the exception of Baytown, TX, all saw an increase in the poverty rate. Housing prices were up for all except for Victoria, TX and Peoria, IL.
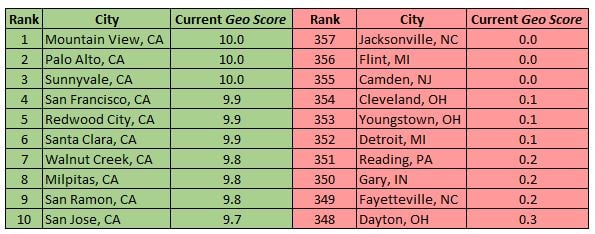
Top and Bottom City Geo Scores for November 2017
Below are the Geo Scores for November 2017 (more can be found on our website). Note California’s clean sweep on the top scores! A first.
 Source: DIVER Data Solutions
A special thanks to Jane Ma and Julie Wen for their always outstanding effort in pulling together our Geo Scores each month.
Have a great week.
Gregg Bienstock