This week we bring you the February 2018 DIVER Geo Scores, focusing on locations with the greatest moves year on year as well as the top and bottom scores at the State, City, and County levels for the month of February.
DIVER Geo Scores are designed to quickly communicate the overall economic health of a selected geographic area on a scale of 0 to 10. The Geo Score reflects the relative economic well-being of the location and is available for all States, counties, and approximately 350 of the largest cities. Calculations are released monthly and are based on multiple, meaningful economic and demographic data from the employment, income and housing categories.
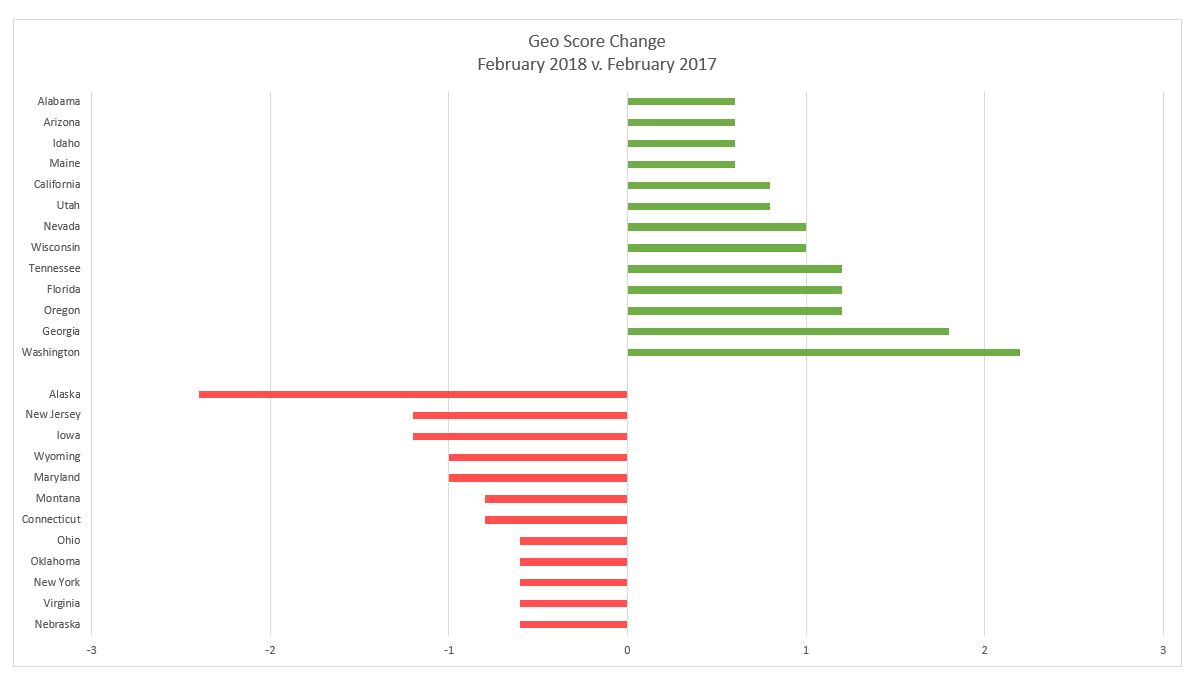
Top/Bottom Movers at the State Level
The chart below highlights the States with the most meaningful moves (positive and negative) year on year. Drops in the unemployment rate and poverty level contributed to improvements for the top 13 states with increases in their Geo Scores (there was a four-way tie at 10).
 Source: DIVER Data Solutions
As for the bottom movers, it is worth noting that high tax states New York, Connecticut, Maryland, and New Jersey all saw a drop in their Geo Score in the immediate aftermath of the new tax reform bill. We are not necessarily suggesting a direct correlation, as the impact of any change will take time, but it is an interesting coincidence. It cannot be considered favorable that these states are already seeing a decline in their Geo Score before the broader impact of tax reform takes hold.
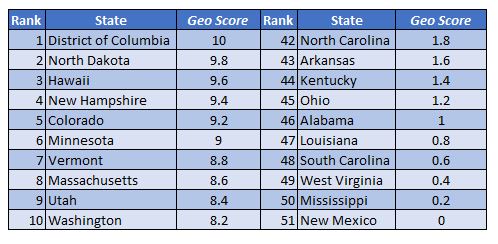
Top and Bottom State Geo Scores for February 2018
Below are the top and bottom February 2018 State Geo Scores (all of which can be found on our website).
 Source: DIVER Data Solutions
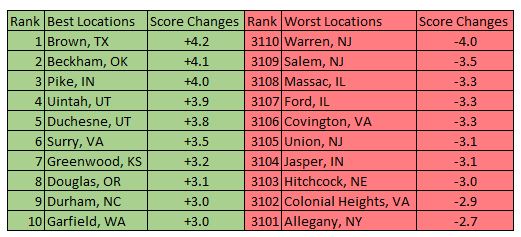
County Level Geo Scores Top and Bottom Movers
At the County level, all the top movers saw an improving employment situation with the exception of Garfield, WA, which stayed the same.
 Source: DIVER Data Solutions
As for our bottom movers, all saw a decrease in labor force participation rate.
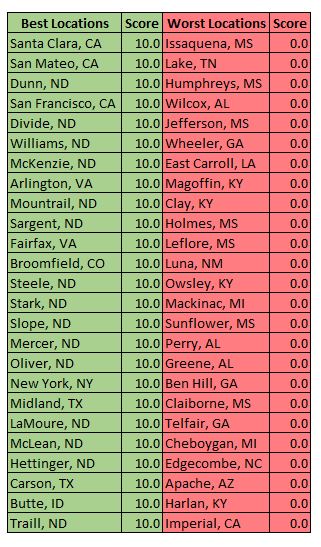
Top and Bottom County Geo Score for February 2018
Below are the high and low Geo Scores for February 2018 (more can be found on our website). All are “10” or “0” so the ordering is not indicative of relative rank.
 Source: DIVER Data Solutions
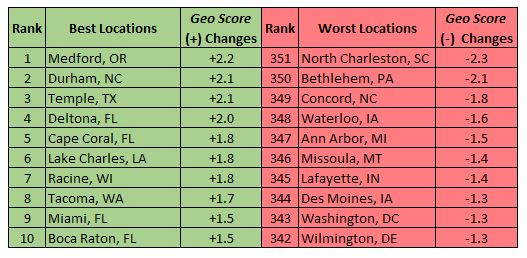
City Level Geo Scores Top and Bottom Movers
The top movers, well represented by the State of Florida (where the author’s nephew took his first steps this week), all saw improvements in their employment and housing data when compared to a year ago.
 Source: DIVER Data Solutions
For the bottom movers the poverty rate was an influential factor for all other than Des Moines, IA which saw a decrease of .04%.
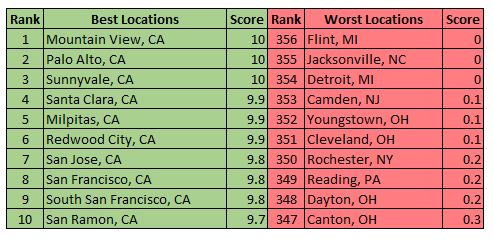
Top and Bottom City Geo Scores for February 2018
Below are Geo Scores for February 2018 (more can be found on our website). Worth noting is that all of the highest ranking cities are in California.
 Source: DIVER Data Solutions
A special thanks to Jane Ma and Julie Wen for their always outstanding effort in pulling together our Geo Scores each month.
Thank you very much and have a great week.