With so much attention on job growth from both the outgoing and new administrations, we thought it would be interesting to take a look at what the data, through the end of 2016, tells us about the employment situation relative to our population. Unlike politicians, we do not seek to cast credit or blame, nor do we seek to see if one party or the other is offering “alternative facts.” Our objective is to offer some observations that can be relevant to those focused on the municipal bond market, and how changes to our population and employment situation may impact municipal credits. As for conclusions, as with our politicians, it is up to you to decide which data points and combinations thereof provide you with the “real” vs. “alternative” facts. I do offer some of my perspective throughout. Due to the number of tables, this commentary will print a bit longer than usual.
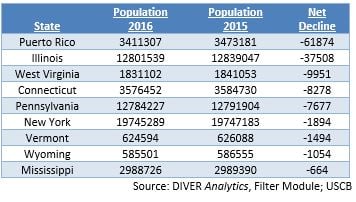
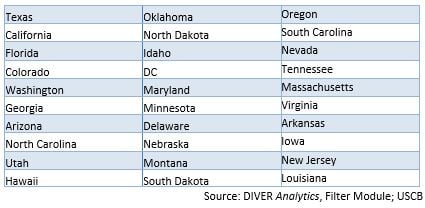
According to the US Census Bureau, the population of our Untied States is about 326.5 million, up from approximately 324.4 million at the end of 2015. Over that same period, 43 States and territories (“States”) experienced growth. Those listed below did not.
The US Census Bureau offers population data based on age groups as well. The last reported was through 2015. For the period from the end of 2014 through the end of 2015, the population of the “working age” group (18-64) (vs. the generally described “dependent” age groups of under 18 and over 64) grew in 30 States (recall we had overall population growth in 43 States – see above).
Growth in working age population can cut both ways – one needs to consider this data in conjunction with Job and Labor Force Growth. Both data points are provided herein (see below), but the money shot is bringing these data points together (DIVER Analytics users can use the Filter or Data Access modules to have at it). A cautionary perspective might be keeping an eye on those States experiencing a growth in the dependent age population.
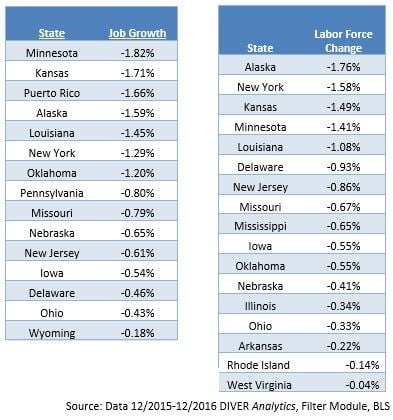
Immediately below, we present two tables – one that shows States that have not experienced Job Growth and the other which shows States that have seen their Labor Force decline. For the period December 2015-2016, 37 States experienced Job Growth and 35 States saw their Labor Force increase.
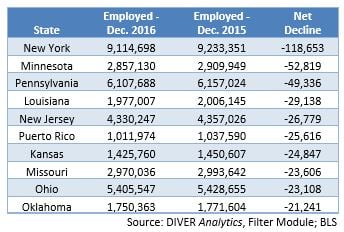
As one contemplates this data, the States identified above are of particular interest, especially when we combine this data with the population data discussed above. The next natural data points to contemplate are growth in the number of Employed People and growth in Employed People as a percentage of the population. 37 States experienced growth in the number of employed people for the period December 2015 through December 2016. Below we highlight those States that saw a decline in the number of employed people.
The last data point we bring you in trek through the data is the number of folks employed as a percentage of the State’s population. Based on USCB and BLS data, we calculate that 33 States have seen this ratio grow while the 19 States in the table below have seen a decline.
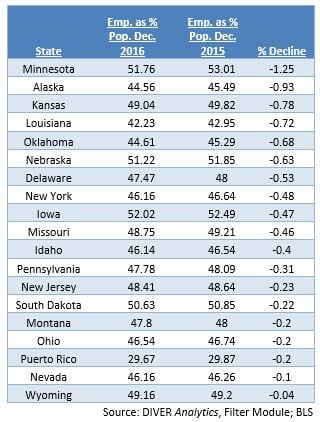
How you combine and assess the above data is up to you. Its impact on the economic well-being of our States cannot be understated. When one considers expenditures, the location of population growth and the make-up of a State’s population can be critical. The presence or absence of job growth is equally as critical to tax receipts and spending. Combining these data points can provide a level of insight, well ahead of a State’s reported data.
As we look ahead, another factor to consider is if, and where, jobs will be created. Since President Trump’s election, several companies have stepped forward to pronounce their planned job growth in the US (I am not suggesting, one way or the other, whether the job growth had already been planned).
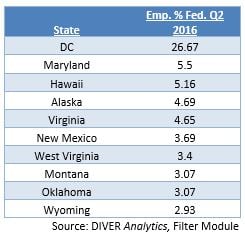
Finally, last week, among his other activities, President Trump put a freeze on the hiring of Federal Government employees and has vowed to scale back the number of Federal Government workers. Below is a look at the top ten States that rely most heavily on the Federal Government as an employer.
Well, that’s it for this week. I think we’ve provided you enough to chew on and explore.
Have a great week.
Gregg Bienstock
CEO and Co-Founder