As March Madness 2017 predictions abounded, so too did predictions about the timing of the next increase in the Fed Funds rate and how many would take place over the course of 2017. The increase in the Fed Funds rate by 25bps on March 15 was of little surprise – less surprising, perhaps, than the eye-popping stats of Gonzaga’s ability to keep possession of the ball or some of the upsets!
The media has created a “March Madness” of its own, as headlines tout the third longest US economic expansion on record, with strong hiring, firming wage growth and steady improvement in the unemployment rate. US consumer and business sentiment is solid (we will refrain from saying “irrational exuberance”) and there is optimism about the potential for accelerated economic growth. However, a few questions remain: is all the good news sustainable? Has this long recovery been even-handed?
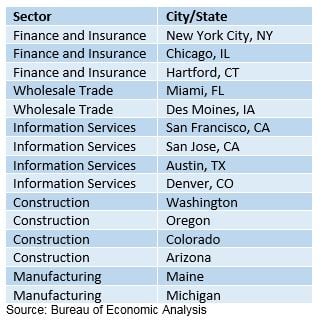
In many instances, there are two sides to a story (sometimes three – his, hers and the truth). As anyone putting together their NCAA brackets knows, there will be winners and losers, and the winners in this economic recovery have not been across the board. There is some concentration throughout certain sectors within certain States and cities. As reported by the Bureau of Economic Analysis (BEA) on February 2nd, real GDP growth in 3Q2016 was led by the following States and cities:
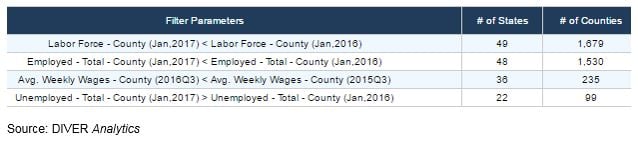
The BLS March 10th report of non-farm job growth of 235,000 was above consensus expectations of 200,000, with a reduction in unemployment to 4.7% from 4.9% this time last year. However, for our “third side of the story,” the employment data tells the tale of the haves and the have nots. Focusing on those areas not sharing in the spoils of the growing economy, we look at the fact that there are 99 counties experiencing declining labor forces, a declining number of employed people, declining wages and an increase in the number of unemployed. The table below provides a breakdown of the number of counties when each filter factor is applied. Of note in the details is the significant presence of Puerto Rico and counties within the States of Texas and Oklahoma. For more details, see the DIVER Analytics Filter module.
ACA Reform
With the proposed ACA reform (“American Healthcare Reform Act of 2017”), questions have arisen about which States may be the likely winners or losers. Some may argue that that Medicaid expansion States (31 and D.C.) could be better positioned to bear the financial burden expected from lowering generous federal Medicaid subsidies in the future. An April 2016 report by the Robert Wood Johnson Foundation, “State Health Reform Assistance Network, Charting the Road to Coverage,” stated that Medicaid expansion had a positive impact on State budgets. The report indicated that the 31 States and DC had general fund savings and new revenue in 2014. Examples include Arkansas, Colorado, Kentucky, New Jersey, and New Mexico. General fund spending on Medicaid in FY2015 in the expansion States grew 3.4% vs.6.9% in non-expansion States, mainly due to the enhanced federal match for adults. Savings in uncompensated care are also reported, which had a positive impact on hospitals. Improved financial performance could provide these States with a cushion against reduced federal subsidies, at least in the near-term.
Conversely, some may argue that that the infrastructure which was built (hospitals, real estate, physician practices, IT) to provide healthcare to an additional 13 million Medicaid enrollees (as estimated in 2016 by the Congressional Budget Office) could collapse under its own weight, should health care subsidies and direct reimbursements be significantly reduced and/or phased out under reform.
Both potential arguments turn on the fact that enhanced federal subsidies, tied to enrolling more individuals under the Medicaid program, were expected to offset State Medicaid expenditures associated with increased enrollment. Until 1/1/17, the Federal government paid 100% of the cost of the expanded Medicaid enrollment. That subsidy is currently 95% and will drop to 90% by 2020, as the ACA was originally written. Since Medicaid expenditures are one of the largest expenditure items in a State’s budget[i], State expenditures had planned on picking up the initial 5% and 10% of the reduced subsidy under the ACA. Now they may need to plan to pay for a whole lot more.
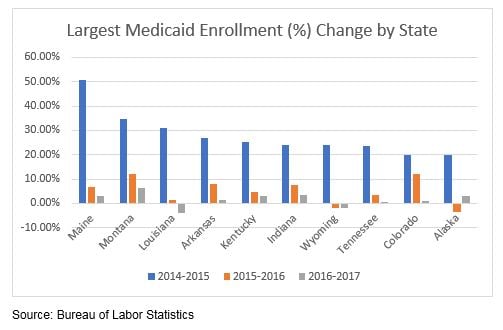
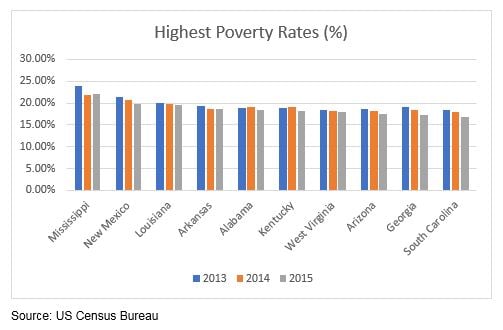
The fiscal stress to States with already relatively poor economies or fiscal stress, as exhibited by poor overall economic metrics and high exposure to Medicaid (see tables below), may well be the States that are the most vulnerable to ACA reform and, hence, the potential “loser” States. The data below provides some insight into which States may be most vulnerable.
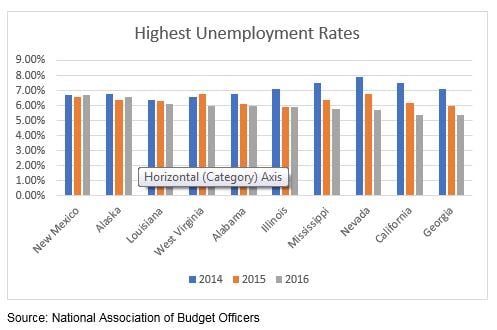
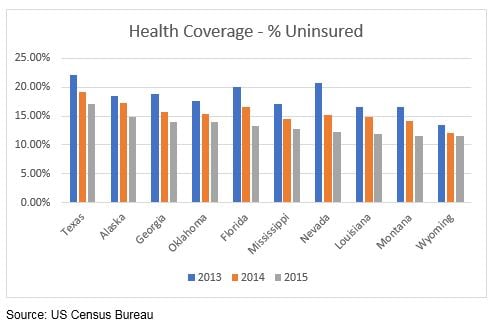
Lots of Data – So Where Are the Common Threads?
As it turns out, many of the oil and gas dependent States are reflected in the above metrics. Alaska and Louisiana have some of the highest unemployment rates and some of the largest percentage of uninsured. Alaska ranks second highest on both metrics. Louisiana ranks third highest for unemployment and eight highest for the percentage of uninsured. The State also shares the third largest increase in the number of Medicaid enrollments as well as the third highest poverty rate. West Virginia also has one of the highest poverty and unemployment rates, ranking seventh and fourth, respectively. Further, as noted in our January 30th Commentary, States that are highly dependent on government employment may be more vulnerable to President Trump’s governmental hiring freeze (or elimination of agencies). Many of these States are also oil and gas dependent States such as Alaska, New Mexico, Oklahoma and Wyoming. Additionally, in our March 6th Commentary, Diver Geo Scores (2017 vs. 2016) pointed to a meaningful decline in employment in Oklahoma, while Wyoming saw the biggest hit to wages. Finally, Louisiana, Oklahoma and Wyoming reflected some of the largest negative moves in Diver Geo Scores (2017 vs. 2016). Could this combination of factors foretell further distress for some of these States?
There are no “bright lines” pointing to the winning or losing States under ACA reform, which is in very early days and certainly subject to negotiation and changes. Issues to be negotiated under reform are highly nuanced and are neither black nor white, neither red nor blue. The threat of pushing down the cost of Medicaid, expanded or not, to the States could become very real. The cost of “free” ACA expansion may catch up with many States, including those identified above. Our Data Solutions and Analytics platform can provide tools to identify multi-faceted trends relevant to areas of concern to our readers or any investments at risk.
ACA Reform and the California Economic Recovery
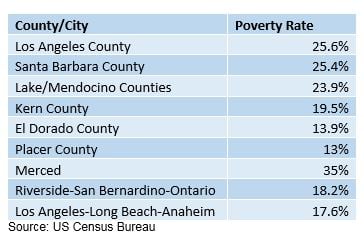
Before I sign off, let’s look at the “economic miracle” of California. Given the foregoing statistics, one might assume that, other than having the largest number of Medicaid enrollees, there is nothing remarkable to be said about the State compared with the other States. California sits squarely in the middle of the pack for the above-mentioned data. Yet despite having the sixth or seventh (depending on which data you look to) largest economy in the world, the benefits of its economic expansion have not been felt evenly throughout the State.
According to the U.S. Census Bureau, the Statewide poverty rate is 15.4% (20.6% when adjusted for the high cost of housing). According to a Public Policy Institute of California report of February 9th, county rates are as follows:
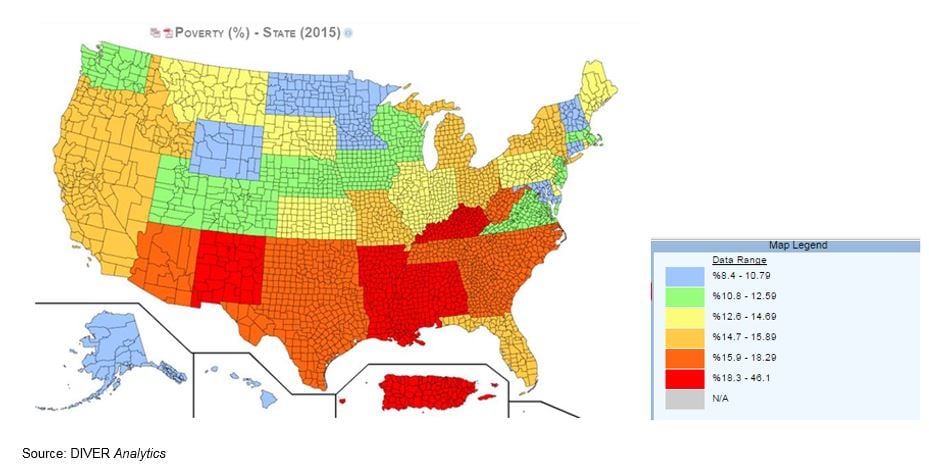
The heat map below illustrating poverty rates, nationwide, show that just a few other States have such high and pervasive poverty levels as found In California.
As to Medicaid expansion, California initially projected enrolling an additional 910,000, but enrollment grew by 3.8 million. Further, far more low-income residents enrolled in Medicaid than was anticipated, so services and dollars typically targeted to individuals with disabilities went to pay costs associated with the expansion population. According to a January 6, 2017 study by George Washington University, repeal of federal premium tax credits and payments to Medicaid expansion States could lead to 2.6 million US jobs lost in 2019, including 334,000 jobs lost in California and $6.8B State and local taxes lost from 2019-2023. The potential of the State and its cities being additionally stressed by any negative financial impact due to ACA reform bears watching.
Enjoy your week,
Lumesis Data Team
[i] See Medicaid and CHIP Payment and Access Commission (MACPAC) of Medicaid’s share of state budgets https://www.macpac.gov/subtopic/medicaids-share-of-state-budgets/